
How many baccarat records are enough for a statistically useful analysis? There is no universal hand count. The answer depends on the outcome, acceptable uncertainty, confidence level, statistical power, and structure of the data. Baccarat Sample Size Calculation for Statistical Analysis is a research-design task—not a betting system or a way to predict the next hand.
What Does Sample Size Mean in Baccarat Statistical Analysis?
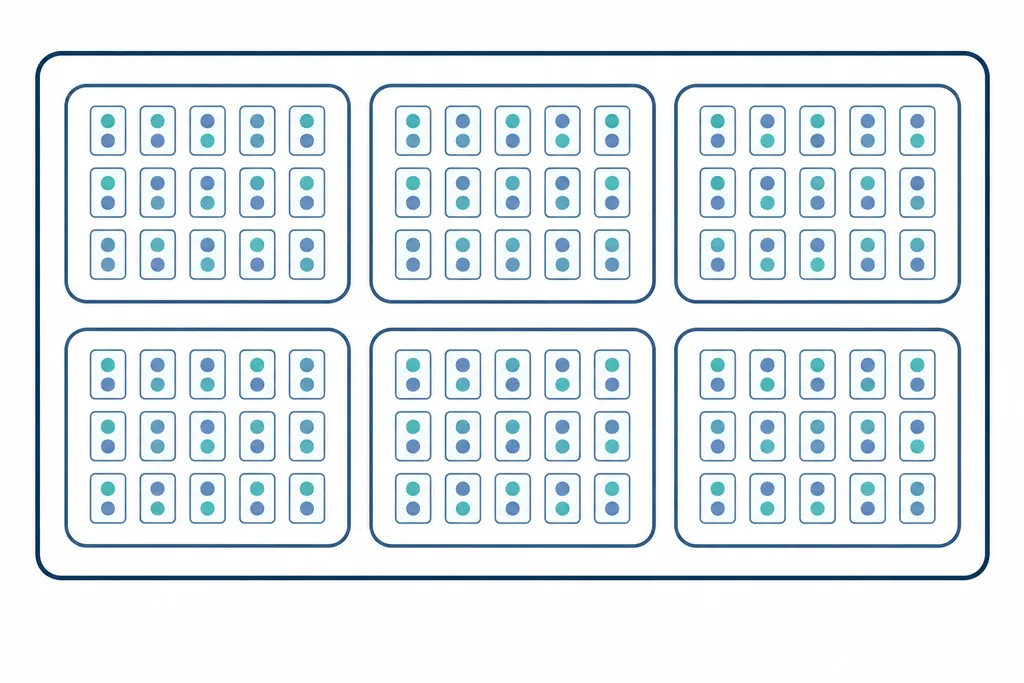
A hand, or coup, is the smallest event, but it is not automatically the right observation unit. Hands are nested within shoes, while shoes may be nested within sessions, tables, platforms, or players. For research about session behavior, the session may be the unit. For shoe-level procedures, the number of shoes matters more than the raw number of hands.
Duplicates and related observations create false precision when treated as independent. Player-provided logs can also favor memorable sessions over ordinary ones. Before calculating n, define what one row represents, its source and inclusion rules, and whether rows share conditions.
Define the Statistical Goal Before Calculating Sample Size
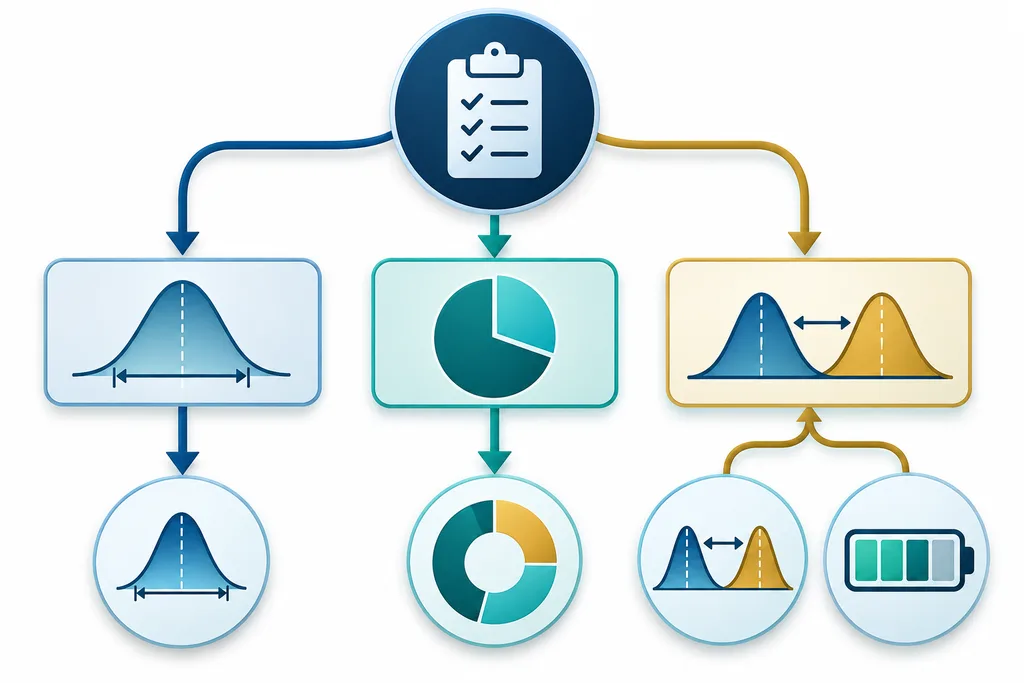
Estimating a mean
Means may include average stake, session length, recorded return, or loss per session. If the population standard deviation is treated as known, a common sample size formula is:
n = (z × σ / E)2
Here, n is the required number of independent observations, z is the confidence-level critical value, σ is the assumed standard deviation, and E is the margin of error. For a two-sided 95% interval, z is approximately 1.96. The NIST guidance for estimating a mean explains this inverse-square relationship and the roles of alpha, beta, variability, and the difference of interest.
If σ is unknown, estimate it from a pilot or relevant earlier study, record the rationale, and consider an iterative t-distribution calculation. Testing several plausible values is safer than depending on one unstable pilot estimate.
Estimating a proportion
Proportions can describe records in a coded outcome category, sessions containing a defined behavior, or occurrences of a specified event. A basic confidence-interval approximation is:
n = z2 × p(1 − p) / E2
In this equation, p is the expected proportion. If no pilot estimate exists, p = 0.5 is a conservative general assumption because it maximizes p(1 − p). It is not a claim about baccarat outcome probabilities.
Testing a difference or effect
A hypothesis test also requires alpha, the false-positive risk; beta, the false-negative risk; statistical power, equal to 1 − beta; and the smallest effect size worth detecting. Smaller effects normally require more data. The NIST method for testing proportions uses the null and alternative proportions, significance level, power, and difference to detect.
How Confidence Level and Margin of Error Change the Sample
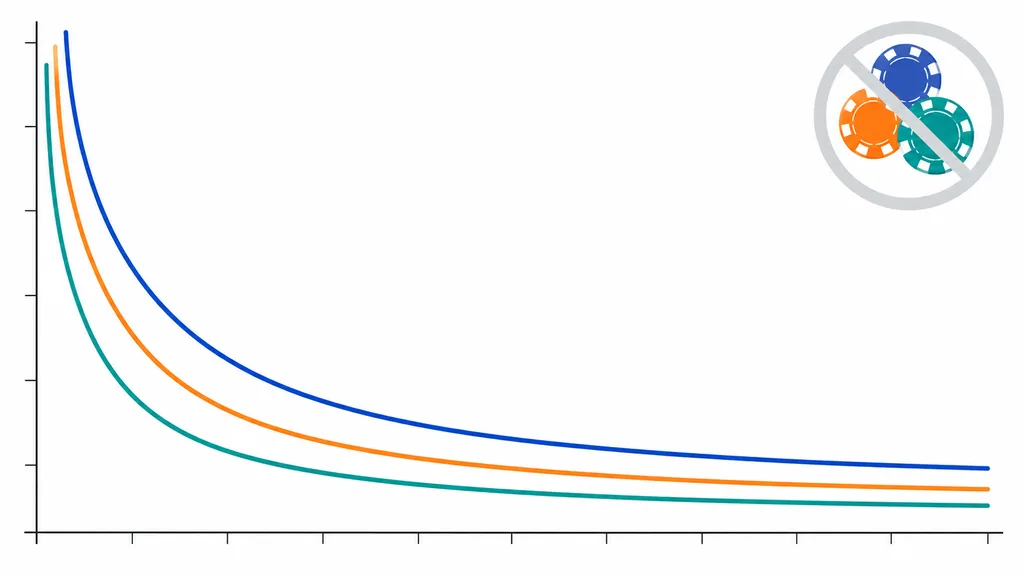
Common two-sided z values are about 1.645 for 90%, 1.96 for 95%, and 2.576 for 99%. With all other inputs fixed, higher confidence increases the required sample. Because E is squared, halving the margin of error requires roughly four times as many independent observations.
“95% confidence” describes the long-run performance of an interval procedure under its assumptions. It does not mean the next hand has a 95% chance of any outcome. The baccarat gambler’s fallacy provides related background on why short runs should not be interpreted as forecasts.
Worked Examples for Baccarat Data Analysis
An illustrative proportion study
Suppose a researcher codes a binary session characteristic and expects p = 0.30. At 95% confidence with E = 0.03, n = 1.962 × 0.30 × 0.70 / 0.032 = 896.37. Round up to 897 independent sessions. This is an illustrative method example, not a win-rate estimate. Different definitions, collection methods, and clustering assumptions change the requirement.
An illustrative mean study
A pilot estimates the standard deviation of session length as 18 minutes. To estimate the mean within 3 minutes at 95% confidence, n = (1.96 × 18 / 3)2 = 138.30, so round up to 139 independent sessions. If 10% of records may be unusable, divide by 0.90 and round up to 155 collected sessions. This allowance anticipates exclusions; it does not correct biased sampling.
Why More Records Do Not Guarantee Better Evidence
- Dependence: Hands in one shoe or session may share conditions. Consider cluster-level analysis, a design effect, cluster-robust methods, or an appropriate bootstrap.
- Selection: Submitted histories may overrepresent unusual outcomes. Define sources and inclusion rules in advance.
- Mixed environments: Online RNG logs, live-dealer streams, and physical-shoe records differ in generation, auditing, timing, and missing-data processes. Pool them only with a documented justification.
- Repeated testing: Testing many outcomes, periods, or subgroups increases false-positive risk. Pre-specify primary analyses or adjust for multiple comparisons.
Audit timestamps, identifiers, duplicates, rule variants, and missing fields. Physical and live-dealer research may also require a separate review of shuffle integrity and data provenance.
A Practical Sample Size Planning Checklist
- State the primary question and outcome variable.
- Choose the unit: hand/coup, shoe, session, player, or table.
- Set the confidence level or alpha and specify one- or two-sided testing.
- Set the margin of error or minimum detectable effect.
- Justify σ or p using pilot data, prior research, or a conservative range.
- Choose the target power and account for clustering.
- Add a documented allowance for missing, excluded, or invalid records.
- Predefine platforms, collection dates, stopping rules, and analysis methods.
Common Sample Size Mistakes
Do not assume that 1,000 or 10,000 hands is always enough, that a large sample removes bias, or that every logged hand is independent. Avoid treating a short streak as long-run evidence, selecting favorable results after seeing the data, or presenting an example calculation as a profit guarantee. Precision applies only to the population and research design that were actually defined.
Final Takeaway
Baccarat Sample Size Calculation for Statistical Analysis has no fixed baccarat number. A defensible sample depends on the objective, outcome, analysis unit, variability or expected proportion, margin of error, confidence level, power, effect size, and dependence structure. Calculate it before collection, round upward, add a documented quality allowance, and validate the data pipeline. Sample-size planning reduces uncertainty; it cannot predict the next result or guarantee gambling profit.