Author name: BCRC Editorial

BCRC
Quantitative Research

Baccarat Hypothesis Testing Checklist: A Research-Quality Workflow

The spreadsheet is still glowing on my monitor long after the evening games have ended. Thousands of baccarat results fill the rows, and one highlighted Banker streak has prompted a dramatic claim: the shoe must be biased. In review work like this, the pattern is worth examining, but it is not yet evidence. Before calculating anything, I need to know how the hands were collected, what claim was defined in advance, and whether the analysis quietly changed after someone noticed the streak.

That distinction is the purpose of this Baccarat Hypothesis Testing Checklist. It is a research workflow for evaluating claims about Banker, Player, and Tie outcomes, card sequences, shuffle integrity, simulated games, player behavior, or random number generator output. It is not a method for predicting the next hand, defeating the house edge, or recovering losses.

Researcher reviewing a baccarat hypothesis testing checklist and outcome data

What Hypothesis Testing Can Actually Establish

A hypothesis test asks whether observed data are reasonably compatible with a specified model. The null hypothesis usually represents the benchmark—for example, that outcome frequencies follow predefined probabilities—while the alternative describes a departure that the study is designed to detect.

The result is conditional. It depends on the model, data quality, sampling method, test choice, and assumptions. A small p-value indicates that a result at least as extreme as the observed one would be unusual if the null hypothesis and its assumptions were true. As the NIST explanation of p-values makes clear, it is not the probability that the null hypothesis is false.

A test can identify a deviation that deserves investigation. It cannot, by itself, prove cheating, certify a game as permanently fair, or guarantee what will happen next. Statistical significance also says nothing automatically about practical importance: a tiny difference may become statistically detectable in a huge file while remaining operationally trivial.

The Baccarat Hypothesis Testing Checklist

I use the following sequence to keep an interesting pattern from becoming an overconfident conclusion. Each item includes a self-diagnostic question that can be answered before publication.

1. Define one precise research question

Replace a broad suspicion such as “the game looks wrong” with a measurable question. Examples include whether the three outcome frequencies differ from a predefined distribution, whether Banker-to-Banker transitions occur more often than the model predicts, or whether shuffled card positions show unexpected dependence.

Keep outcome questions separate from behavior questions. “Did Banker occur unusually often?” concerns game results. “Did players increase stakes after Banker wins?” concerns decisions. Those questions require different variables, assumptions, and tests.

Self-diagnostic: Could another researcher identify exactly what is being tested without asking what “suspicious” means?

2. Write the null and alternative hypotheses

State both hypotheses before inspecting the result. For a three-category frequency test, the null might say that Banker, Player, and Tie proportions equal a predefined theoretical or specification-based distribution. The alternative might say that at least one proportion differs.

Use a one-sided alternative only when direction was justified in advance. If either an excess or shortage would matter, a two-sided test is normally the honest choice. Selecting a direction after seeing the data understates uncertainty.

Self-diagnostic: Were the hypotheses written before the most interesting pattern was selected?

3. Define every variable and expected distribution

Document how Banker, Player, Tie, void rounds, incomplete rounds, duplicate records, and correction events are coded. For card-level research, define rank, position, deck or shoe identifier, cut point, and reshuffle boundary. For RNG work, distinguish raw generator output from values that have been scaled, mapped to cards, shuffled, or processed by game rules.

Expected probabilities must match the actual game configuration and research question. Rules, deck count, drawing logic, and treatment of ties can affect the benchmark. Do not substitute a remembered headline probability for a model defined for the game being studied.

Self-diagnostic: Could every row be classified consistently using a written data dictionary?

4. Validate the data source

Record the source, collection period, time zone, game version, table or software identifier, and extraction method where available. Check for missing hands, duplicated rows, impossible timestamps, format changes, selective recording, and interrupted shoes. A clean-looking file can still be a biased sample if it contains only memorable sessions or reported streaks.

Document every exclusion and its reason. If cleaning decisions change after results are calculated, preserve both the original and revised analyses.

Self-diagnostic: Can I explain where the data came from and account for every removed observation?

5. Examine independence and clustering

Many textbook tests assume independent observations. Baccarat records may be clustered by shoe, table, dealer, software version, session, player, or collection device. Card outcomes within a finite shoe also arise from a changing composition, so treating every hand as identically distributed and independent may be inappropriate for some questions.

The solution may involve analyzing at shoe level, modeling clusters, testing transitions, or using a simulation that reproduces the dealing process. Independence should be investigated, not assumed merely because each hand occupies a separate row.

Self-diagnostic: What shared process could connect neighboring records, and has the analysis accounted for it?

6. Plan sample size and statistical power

There is no universal number of baccarat hands that makes a test adequate. Required sample size depends on the significance level, desired power, variability, number of categories, model, and smallest meaningful effect. A thousand hands might detect a large discrepancy but miss a subtle one; it cannot be labeled sufficient without defining the target effect.

Plan the sample before testing whenever possible. If the sample is fixed, report what effect sizes it could plausibly detect instead of presenting the available number as automatically adequate.

Self-diagnostic: Have I specified the minimum difference that matters and assessed whether the study could detect it?

7. Set alpha and the analysis plan in advance

Alpha is the threshold used to decide when evidence is sufficiently incompatible with the null hypothesis for rejection. Choose it before viewing the outcome, and preregister the primary variables, exclusions, test, direction, sample endpoint, and treatment of missing data when the project permits.

Repeatedly testing every table, window, streak length, and outcome creates opportunities for false alarms. Correct for multiple comparisons, label exploratory work honestly, and confirm discoveries on new data.

Self-diagnostic: How many analytical choices or tests were attempted before the reported result appeared?
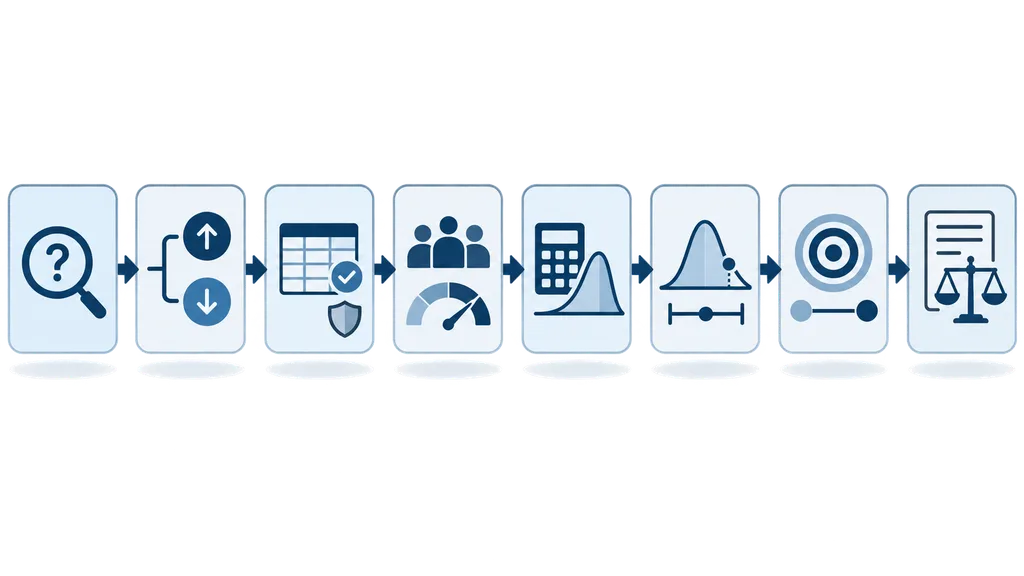
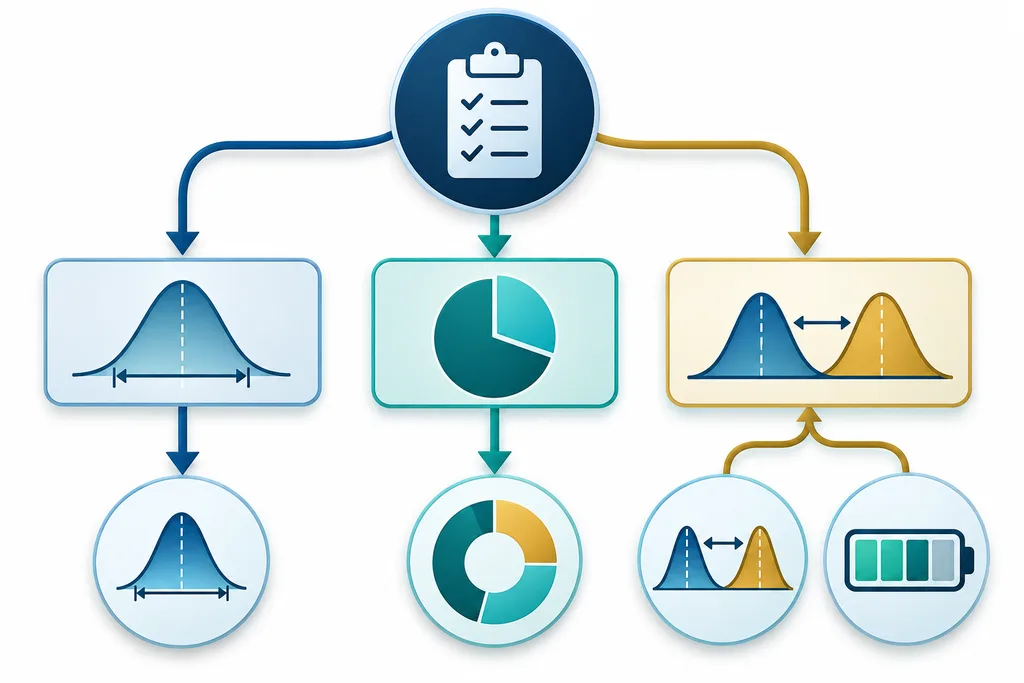
Flowchart for conducting a baccarat hypothesis test

8. Select a test that matches the claim

A chi-square goodness-of-fit test may suit a comparison of observed Banker, Player, and Tie counts against fully specified expected proportions, provided expected counts and assumptions are appropriate. A binomial or proportion test may fit a predefined two-category question. Runs, transition, serial-correlation, or permutation procedures can address sequence behavior, but each targets a different property.

Simulation or resampling is often helpful when dealing rules, finite-shoe structure, rare ties, small expected counts, or complex dependence make a simple approximation questionable. The simulation must reproduce the null process faithfully; otherwise, precision in the output disguises weakness in the model.

Self-diagnostic: Does the chosen test answer the original question under assumptions that the data reasonably satisfy?

9. Report p-values, confidence intervals, and effect sizes

Never allow a p-value to carry the entire conclusion. Report the observed and expected values, test statistic, degrees of freedom where relevant, exact or appropriately rounded p-value, and an effect-size measure. Add confidence intervals for proportions, differences, or other key estimates.

For corresponding procedures, confidence intervals and hypothesis tests express related information: a hypothesized value outside the relevant interval is associated with rejection at the matching significance level. More importantly, the interval shows the range of effect sizes that remain compatible with the data.

Self-diagnostic: Can the reader judge the size and uncertainty of the deviation, not merely whether p crossed a threshold?

10. Interpret the result without overclaiming

“Fail to reject” does not mean “prove fair.” It may reflect compatibility with the model, inadequate power, noisy data, or an insensitive test. Likewise, rejection does not prove fraud. Possible explanations include collection errors, model misspecification, dependence, undisclosed rule differences, repeated testing, software implementation problems, or a genuine deviation requiring controlled follow-up.

A passing randomness test covers only the property and sample examined. Formal RNG evaluation can also require documentation review, source-code examination, raw-output testing, and checks of scaling, shuffling, mapping, and final game behavior. The UK Gambling Commission testing procedure illustrates this layered approach for its jurisdiction; it should not be treated as universal global law.

Self-diagnostic: Have I listed credible alternative explanations and stated what additional evidence would distinguish among them?

A Compact Review Table

Checklist itemWhat to verifyQuestion to ask
ClaimSpecific outcome, sequence, or behaviorWas it defined before inspection?
ModelRules and expected distributionDoes it match this game?
DataSource, completeness, and exclusionsCould selection change the result?
DependenceShoes, sessions, tables, and versionsAre rows truly independent?
DesignPower, alpha, and multiple testingWas the plan fixed in advance?
ReportingEffect size, interval, and limitationsIs practical importance visible?

A Short Banker, Player, and Tie Example

Suppose a researcher wants to determine whether outcome frequencies depart from a predefined distribution. No real audit data are needed to describe the plan. First, specify the applicable game rules and expected Banker, Player, and Tie probabilities. Then define the null as equality with those probabilities and the alternative as a difference in at least one category.

Next, choose a collection period and sample endpoint, validate complete records, decide how void rounds are handled, and examine clustering by shoe. Plan an appropriate goodness-of-fit procedure or a rule-faithful simulation, set alpha, define any follow-up comparisons, and assess power for a meaningful deviation.

After the sample closes, report category counts and proportions, expected counts, the test result, effect size, and uncertainty intervals. If the overall test rejects the null, investigate which categories contributed while accounting for follow-up comparisons. The conclusion should say that the observations were inconsistent with the specified model under stated assumptions—not that cheating was proven.
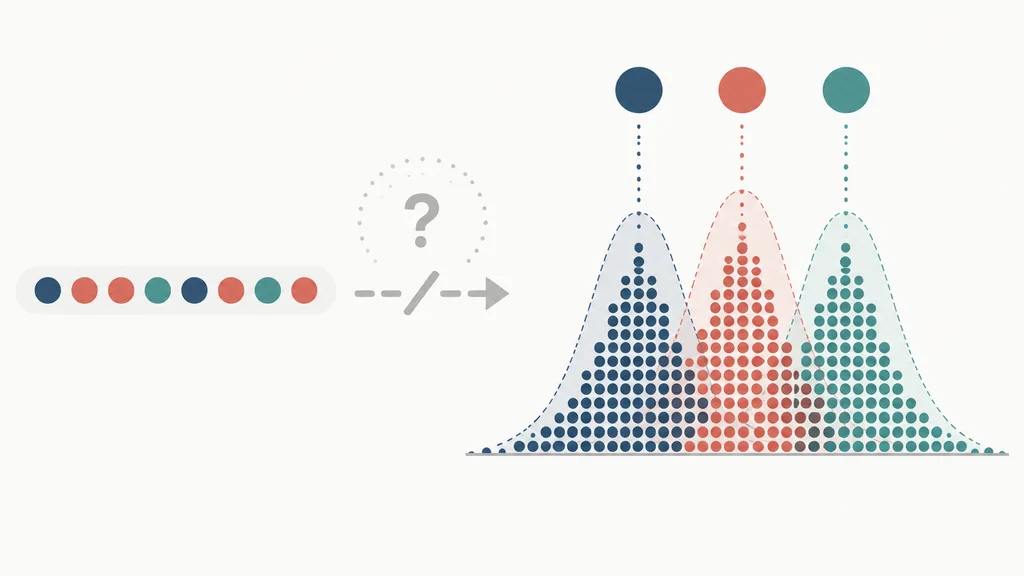
Educational comparison of a baccarat streak and long-run outcome distribution

Frequently Asked Questions

Does a small p-value prove cheating?

No. It indicates that the observed result would be unusual under the null model, assuming the test and data are valid. Data errors, dependence, rule mismatches, multiple testing, or implementation issues may also produce a significant result.

Are 1,000 hands enough?

Not as a universal rule. Adequacy depends on the effect you want to detect, desired power, alpha, outcome variability, test design, and dependence structure. State those inputs before deciding whether any sample is sufficient.

Does every streak require a statistical test?

No. A streak can simply be described. Test it only when there is a meaningful predefined claim about run length, transition frequency, or independence. Searching many possible streak definitions after the fact demands multiple-testing controls and independent confirmation.

Does passing a randomness test prove a game is fair?

No. It means the examined sample was compatible with the tested property and model. Fairness is broader and may involve implementation, mapping, rules, security, controls, and independent technical review.

Final Self-Diagnostic Before Publishing

  • Did I define the claim, hypotheses, expected distribution, alpha, and stopping rule before examining the decisive result?
  • Did I document the source, missing records, exclusions, duplicates, rule version, and shoe or session boundaries?
  • Did I justify independence assumptions, sample size, power, test selection, and multiple-comparison handling?
  • Did I report effect sizes and confidence intervals alongside p-values?
  • Did I distinguish exploratory findings from confirmatory tests?
  • Did I avoid claims about prediction, guaranteed profit, fraud, or permanent fairness?
  • Could another researcher reproduce the workflow and understand its limitations?

Disciplined Uncertainty Beats a Dramatic Pattern

When I return to that highlighted Banker streak, the rows look no less interesting than they did at the beginning. What has changed is the quality of the question. The Baccarat Hypothesis Testing Checklist turns visual surprise into a documented process: define the claim, protect the data, choose the model, quantify uncertainty, and resist conclusions the evidence cannot carry.

A streak may lead to a worthwhile investigation, and a significant deviation may justify controlled follow-up. Neither supplies tomorrow’s result or a ready-made accusation. In baccarat research, disciplined uncertainty is not a weakness. It is what keeps an arresting pattern from being mistaken for knowledge—and what makes genuine evidence easier to recognize when it finally appears.

Market Analysis

Online Baccarat Market Analysis Checklist for Evaluating Operator Performance

The dashboard looks encouraging at first glance: visits are climbing, new registrations have jumped, and baccarat turnover is higher than it was last month. Then the analyst opens the returning-user report, subtracts promotional costs, and checks failed deposits. Suddenly, the growth story becomes less convincing.

This Online Baccarat Market Analysis Checklist for Evaluating Operator Performance is designed for exactly that situation. It provides a repeatable framework for examining commercial strength, data quality, operational reliability, and player safeguards without confusing visible activity with sustainable performance. It is not a betting guide, a market-size report, or a method for predicting baccarat outcomes.

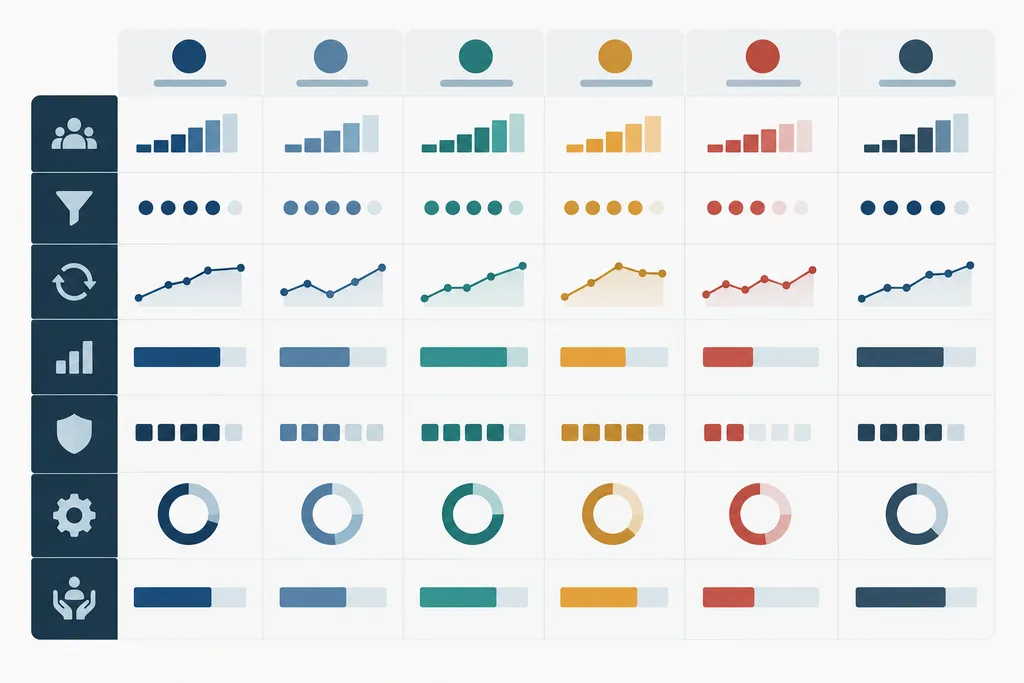
Analyst reviewing traffic, conversion, retention, and revenue metrics in an online baccarat operator dashboard.

What This Operator Analysis Should Measure

Separate market reach from operator quality

Reach describes how many people an operator can attract. Quality describes what happens after they arrive: whether registration works, payments succeed, users return without constant incentives, records remain accessible, and revenue survives the deduction of bonuses and operating costs. A large audience can coexist with weak economics or poor service.

Check: Record traffic, acquisition, conversion, retention, player value, revenue quality, reliability, compliance, and responsible-gambling indicators as separate metric groups. Do not allow one unusually strong group to conceal deficiencies elsewhere.

Define the reporting window, market, and cohort

Every comparison needs a consistent timeframe, jurisdiction, currency, product definition, and customer identity rule. A monthly mobile cohort in one regulated market should not be compared casually with an annual, all-device total from another. Seasonal campaigns, tracking changes, and newly launched markets can also distort period-over-period growth.

Self-diagnosis: Could another researcher identify precisely who was counted, where, during which dates, in what currency, and under which definition of an active customer?

Checklist 1 — Verify Traffic Quality Before Judging Growth

Check users, sessions, sources, geography, and device mix

Begin with users and sessions, then segment them by source and medium, landing page, geography, device, paid-versus-organic mix, and suspected bot activity. Sessions alone are especially weak evidence because repeat visits, automated traffic, or low-intent campaign clicks can inflate them without improving customer value.

Compare branded acquisition, in which visitors already know the operator, with non-branded discovery. Rising branded searches may indicate awareness, while a surge from a loosely targeted paid placement may produce registrations that never reach a baccarat session.

  • Do source totals reconcile with campaign and affiliate records?
  • Are excluded jurisdictions or unexpected locations appearing?
  • Did a device-mix change coincide with lower payment completion?
  • Did traffic rise because tracking began firing twice?

Self-diagnosis: If traffic grew but qualified registrations, completed deposits, and returning cohorts did not, treat the headline increase as an investigation lead rather than a success.

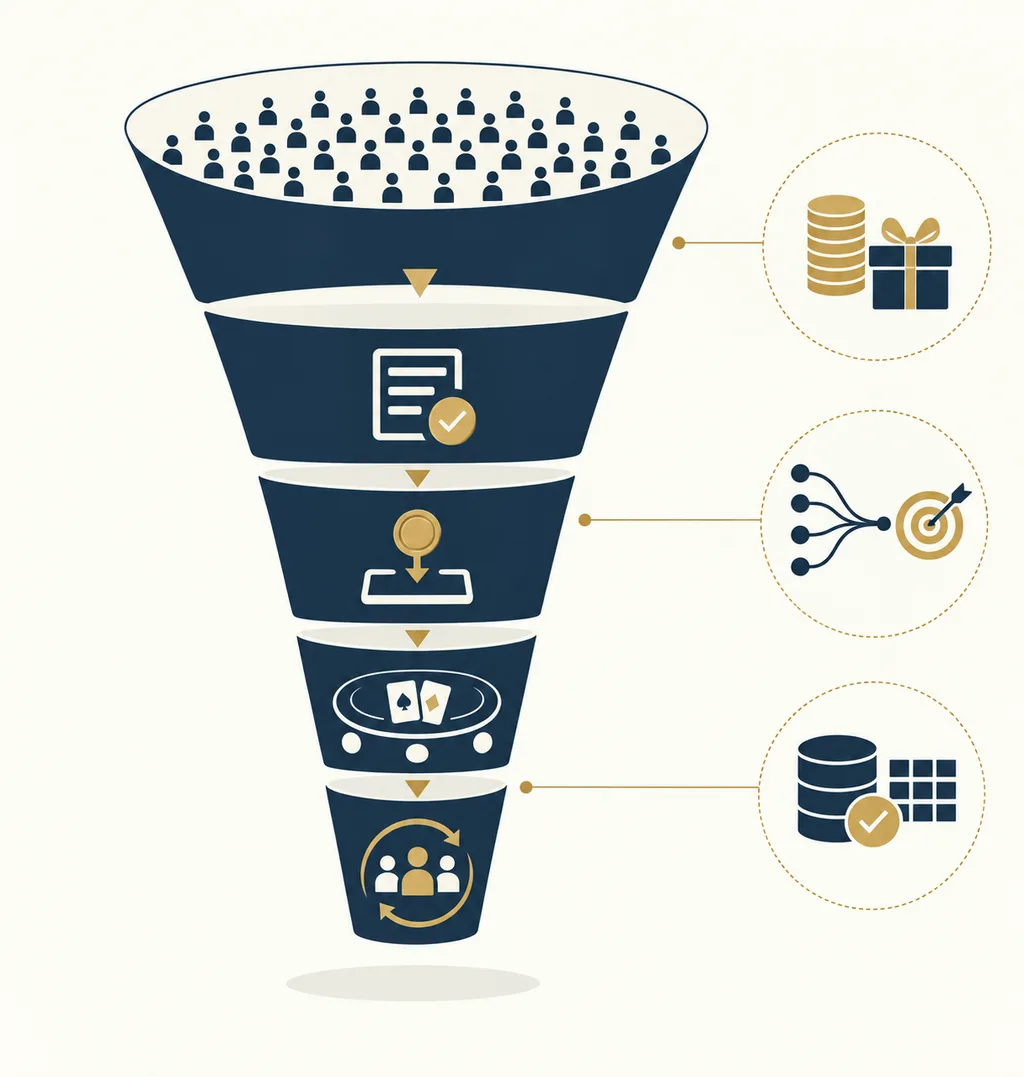
Checklist 2 — Audit the Registration and First-Deposit Funnel

Measure each eligible step

Map the funnel from eligible visitor to registration, first deposit, first baccarat session, and repeat session. Conversion rate equals completed target actions divided by eligible visitors or users; the denominator must match the question. A registration-to-deposit rate cannot use all site sessions as its denominator.

Reliable analysis also depends on event instrumentation. Properly configured Google Analytics ecommerce measurement can capture product interactions, purchases, and promotion performance, illustrating why pageviews alone cannot explain a commercial funnel.

Segment results by channel, device, jurisdiction, payment method, and baccarat product. A blended rate may hide an excellent desktop funnel and a broken mobile deposit path.

Self-diagnosis: Does conversion remain healthy after bonus-led campaigns are separated? If the funnel collapses when a promotion ends, efficiency may be incentive-dependent.

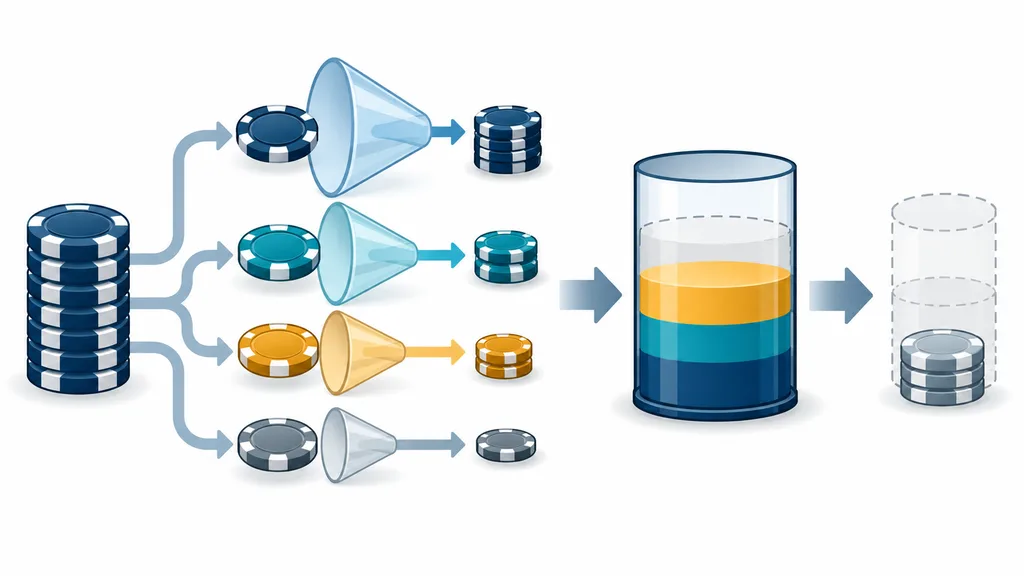
Operator-performance funnel from traffic and registration to deposits, baccarat sessions, and retention.

Checklist 3 — Evaluate Retention Through Player Cohorts

Compare return behavior over consistent windows

Measure Day-1, Day-7, Day-30, and longer-term returning activity for customers acquired during the same period. Cohorts reveal whether recent acquisition is improving; a single blended percentage can be dominated by older, unusually loyal users.

Retention rate for a cohort equals returning users from that cohort during the chosen period divided by users in the original cohort. Add repeat deposits, repeat baccarat sessions, churn, and reactivation where definitions are stable. Then compare behavior during and after promotional eligibility.

Self-diagnosis: Are newer cohorts returning after bonuses expire, and do they complete ordinary sessions without escalating promotional expense? Strong acquisition followed by deteriorating Day-30 activity is not durable growth.

Checklist 4 — Inspect Revenue Quality, Not Revenue Alone

Define every revenue layer

Turnover is the amount wagered; it is not revenue. Gross gaming revenue generally reflects stakes less winnings under a stated accounting definition, while net revenue may deduct bonuses, refunds, payment expenses, taxes, or other costs. Because reporting conventions vary, never use these labels interchangeably.

A transparent net revenue proxy can be written as stated gross revenue minus bonuses, refunds, payment costs, and every other explicitly included cost. Label it as a proxy when complete finance data is unavailable.

Revenue per active user equals the chosen revenue measure divided by active users in the same period. Customer lifetime value, contribution margin, and payback period are estimates rather than facts unless their assumptions are disclosed. A simple payback estimate is acquisition cost divided by estimated contribution per period.

Self-diagnosis: Would the revenue trend remain positive after promotion and acquisition costs? Check whether growth came from new customers, existing-customer activity, currency movements, or a temporary concentration of high-value accounts.

Checklist 5 — Examine Baccarat Product Performance Carefully

Compare like with like

Separate live-dealer baccarat, standard online versions, mobile activity, and side-bet participation only when event and accounting definitions are comparable. Review active players, session length, bet frequency, stake distribution, interruptions, and volatility, but interpret each within a sufficiently long observation window.

Short-run player wins or operator wins are not evidence of management skill, product fairness, or algorithmic failure. In fairness-review work, game records and audit procedures require a distinct methodology; a volatile revenue month cannot substitute for an audit.

Self-diagnosis: Are you measuring customer and product behavior, or turning random short-term results into a convenient performance story?

Checklist 6 — Test Data Integrity and Attribution

Reconcile the evidence trail

Compare analytics events with payment records, game logs, promotion ledgers, and finance reports. Check duplicate transactions, missing jurisdictions, timezone boundaries, currency conversion, sample size, bot filtering, and tracking changes. First-touch attribution emphasizes discovery, while last-touch emphasizes the final interaction; neither automatically captures the complete customer journey.

User identity deserves particular attention. Device-only measurement may split one person across a phone and computer, while an incorrectly implemented user identifier may merge or duplicate records. Customer totals, retention, and lifetime value can all change according to the identity rule.

  • Document event names and eligibility rules.
  • Record data sources, exclusions, and transformation steps.
  • Recalculate a sample from raw records where access permits.
  • Keep uncertainty visible when only public estimates are available.

Self-diagnosis: Could another analyst reproduce the result from the definitions and source trail, or does the conclusion depend on an undocumented dashboard filter?

Checklist 7 — Include Reliability, Transparency, and Compliance

Measure the experience around the game

Where data is available, review uptime, interrupted sessions, failed deposits, withdrawal delays, dispute frequency, and support-resolution time. Also examine whether customers can see current balances, deposits, withdrawals, bets, results, winnings, and relevant bonus information. Accessible account records are both a trust signal and a practical foundation for resolving discrepancies.

Player safeguards belong in the scorecard. Check whether financial-limit tools are easy to find from registration, apply at the appropriate account level, explain their timeframes, and use appropriate cooling-off treatment for increases. The UK Gambling Commission’s financial-limits requirements provide one useful jurisdiction-specific reference, not universal legal advice.

Review licensing information, visible rules, transparent terms, responsible-marketing controls, self-exclusion access, and interventions prompted by risky behavior. Do not declare an operator compliant merely because a badge or policy page is visible; verification requires evidence and jurisdiction-specific review.

Self-diagnosis: Is commercial growth accompanied by reliable service, usable controls, and auditable customer information, or are those costs being pushed out of sight?

Build a Simple Operator Scorecard

Metric groupEvidence to reviewTypical warning
Traffic qualitySources, locations, devices, landing pagesSessions rise without qualified actions
ConversionRegistration, deposit, first and repeat sessionPerformance disappears without bonuses
RetentionCohorts, repeat deposits, churn, reactivationBlended rates conceal weak new cohorts
Revenue qualityDefined revenue, costs, contribution, paybackTurnover is presented as revenue
Data integrityIdentity, reconciliation, attribution, exclusionsResults cannot be reproduced
Operations and safeguardsPayments, uptime, support, limits, recordsGrowth coincides with service or control failures

Weighting should reflect the purpose of the review. An acquisition audit may give more weight to traffic and conversion, while a sustainability review should emphasize retention, contribution, reliability, and safeguards. Publish the weights before scoring so that they cannot be adjusted to favor a preferred conclusion.

Trigger deeper investigation when definitions change mid-period, one channel dominates growth, bonuses consume the apparent gain, small samples produce dramatic percentages, unsuccessful operators disappear from the comparison, or public estimates are presented with false precision. Survivorship bias is particularly dangerous when only visible, active operators remain in the dataset.

Scorecard comparing online baccarat operator performance across commercial, operational, and responsible-gambling metrics.

Final Self-Diagnosis

  • Have I kept the timeframe, jurisdiction, currency, and customer definition consistent?
  • Have I separated acquisition volume from commercially valuable traffic?
  • Can I distinguish turnover, gross revenue, net revenue, and contribution?
  • Have I tested retention by cohort and beyond promotional periods?
  • Have I disclosed attribution, identity, sampling, and cost assumptions?
  • Have I included reliability, transparency, compliance, and player safeguards?
  • Can another researcher reproduce or reasonably challenge my conclusion?

This framework is educational and is not personal financial or legal advice. Gambling activity must comply with the reader’s jurisdiction and personal limits.

Frequently Asked Questions

Which metric matters most when comparing operators?

No single metric is sufficient. Cohort retention and contribution can reveal durability, but they remain unreliable if identity rules, cost definitions, or source data are weak. The strongest assessment explains how the measures interact.

How can I compare operators without private revenue data?

Use observable evidence such as traffic composition, product availability, service interruptions, terms, account tools, and public disclosures. Label estimates clearly, compare consistent periods, and avoid manufacturing precise lifetime-value or net-revenue figures.

Does high baccarat traffic prove strong performance?

No. Traffic may be low-intent, promotion-driven, duplicated, automated, or poorly converted. Follow it through registration, deposits, product use, retention, costs, and service outcomes.

Why include responsible-gambling indicators?

Accessible limits and transparent account information affect trust, customer outcomes, operational risk, and the sustainability of acquisition. A scorecard that records revenue while ignoring these conditions presents an incomplete business picture.

When the attractive dashboard numbers have been stripped of inconsistent definitions, temporary incentives, and missing costs, the final question is simple but demanding: is the operator genuinely improving customer value and transparency, or merely becoming better at optimizing the numbers everyone can see?

Market Analysis

Does Online Baccarat Market Data Really Predict Player Behavior?

A player sits beneath the blue light of a late-night screen, watching a dashboard where baccarat volume is rising, Banker has appeared five times in a row, and average evening sessions are stretching longer. The charts look persuasive enough to suggest that the market is revealing its next move. But does online baccarat market data really predict player behavior?

The short answer is that market data can reveal correlations and recurring tendencies across groups, but it cannot reliably predict every individual decision—and it cannot tell us the next baccarat result. That distinction matters. Behavioral prediction estimates what people may do under certain conditions; risk detection identifies activity that may deserve attention; outcome prediction claims to anticipate Player, Banker, or Tie. Those are three different analytical targets, even when a dashboard blends them together.

Analyst reviewing online baccarat market data while a player watches a streak dashboard

What Does Online Baccarat Market Data Actually Measure?

Before judging a prediction, I first ask what the underlying rows represent. Market-level data can include total wagering volume, average stake, table traffic, deposits, session duration, bet-type distribution, and activity by time of day. It summarizes a population and is useful for identifying broad movement, such as increased evening traffic or a shift toward lower-stake games.

Player-level behavioral data follows an account over time: deposit frequency, wagering frequency, losses, changing stakes, session length, breaks, and game selection. Outcome data is different again. It records historical Player, Banker, and Tie results or card sequences.

These categories may interact without being interchangeable. A visible streak may alter betting patterns, but player reactions do not alter a properly randomized game’s underlying process. Longer sessions may coincide with a promotion, yet that does not explain each participant’s motive. Even the same metric can mean something different across platforms, game formats, observation periods, jurisdictions, and customer populations.

Myth 1: A Strong Baccarat Trend Predicts the Next Winning Side

A streak is a real description of what has already happened. It can also influence what happens next in human behavior: some players follow the run, others bet against it, and others stop. In community discussions and game-log reviews, this is where two meanings of “trend” are commonly collapsed into one.

A pattern that changes player choices is not necessarily a pattern that changes the next game result. In regulated remote-gambling environments overseen by the UK Gambling Commission, random outputs are expected to be demonstrably random and computationally impractical to predict from previous outputs. Its random-number generation requirements also address uniform distribution, seeding, scaling, and randomized finite sets such as shuffled decks.

That standard should not be treated as a claim about every platform worldwide, and finite-card games have implementation details that matter. Still, a historical run alone does not establish an exploitable next outcome. It may help predict that some players will keep following Banker; it does not prove Banker will win the next hand.

Myth 2: More Betting Activity Means the Market Knows What Players Will Do

Rising volume, larger average stakes, or longer sessions can signal increased attention, but several explanations may fit the same chart. A promotion may have attracted occasional users, a high-value segment may be unusually active, or normal time-of-day effects may be lifting traffic. An aggregate can move even while most individuals change nothing.

UK Gambling Commission research on safer-gambling algorithms illustrates the need for restraint. Its limited snapshot of seven operators, largely concerning slots data, found that consumers flagged as higher risk existed across staking and spending levels. It reported a slight relationship between higher stakes and higher-risk flags, but described that relationship as inconclusive and not necessarily linear. The publication also noted that flags were imperfect proxies and did not show what happened after customers were identified.

That is a useful warning against reading a risk flag as proof of harm—or importing a slots finding directly into baccarat. Common distortions include:

  • Selection bias: observed accounts may not represent the wider market.
  • Survivorship bias: active users remain visible while people who leave disappear.
  • Aggregation: opposite individual behaviors can cancel out or create a misleading average.
  • Seasonal and promotional effects: campaigns, holidays, and product changes can imitate lasting behavioral shifts.
  • Customer-mix confusion: one operator’s audience is not a universal model of baccarat players.

Myth 3: AI Can Read a Player’s Next Decision With Certainty

Machine learning can detect associations that are difficult to see in a simple chart, but its value depends on a clearly defined target. Predicting whether an account belongs to a risk category is not the same task as predicting its next wager, and neither task predicts the next baccarat outcome.

A peer-reviewed study by Auer and Griffiths began with 1,287 European online casino players who completed the Problem Gambling Severity Index. The researchers matched self-reported responses with account behavior, including wagering, deposits, frequency, losses, and account depletion. After response-time cleaning, 945 records remained for analysis. Random-forest and gradient-boosting models were trained to classify the defined self-reported label, with separate training and test data.

The study found meaningful group differences, including losses per gambling day, losses per session, and deposit frequency. Yet its target was self-reported problem gambling, not a player’s next baccarat choice. It was one casino sample rather than a baccarat-only global population. Classification produces estimated probabilities and thresholds, not mind reading; false positives and false negatives remain, and results can weaken when customers, products, or market conditions change.

Conceptual comparison between player behavior signals and unpredictable baccarat outcomes

Myth 4: A Large Dataset Automatically Produces Reliable Predictions

Millions of records cannot rescue the wrong label, a biased sample, missing context, or information captured after the event being predicted. A large operator dataset may describe that operator exceptionally well while performing poorly on a smaller platform, another country, or a new game interface.

I am especially cautious when a model is tested on randomly mixed records from the same players. Near-duplicate behavior can leak across training and test sets, making performance look stronger than it will be on genuinely new accounts or future periods. Time-separated and player-separated evaluation usually presents a more demanding question.

The NIST AI Risk Management Framework offers a useful general lens—validity, reliability, transparency, monitoring, and context—but it does not certify gambling models. A polished AI label is not evidence by itself. Readers still need the target definition, evaluation design, baseline comparison, error rates, and limits.

What Market Data Can Predict More Responsibly?

The most defensible interpretation is usually conditional: a signal may justify closer analysis, but it rarely establishes motive or cause on its own.

Data signalWhat it may suggestWhat it cannot prove
Rising session frequencyPossible increase in engagementLoss chasing
Larger depositsA change in spending behaviorFinancial harm
Longer sessionsMore time on the platformImpaired control
Repeated betting after lossesA possible loss-chasing patternThe player’s motive without context
Following visible streaksTrend-following among some playersThe next baccarat result
Changing bet sizeA response to results, promotions, or bankroll changesOne specific cause

These signals are better suited to generating questions than verdicts. Account history, product design, timing, and customer interaction may add context, while direct support and responsible-gambling controls should never depend on a single unexplained score.

How to Audit a Baccarat Prediction Claim

When I compare a dashboard with raw game records or check whether a pattern survives a holdout sample, I use a short audit sequence:

  1. Define the target. Is the claim about the next bet, future activity, a risk label, or a game result?
  2. Separate behavior from outcomes. A model of player reactions is not a model of card results.
  3. Check the sample and timeframe. Identify the platform, games, jurisdictions, account types, and observation window.
  4. Demand out-of-sample validation. Look for testing on later periods, unseen players, or a genuinely different dataset.
  5. Compare a simple baseline. An elaborate model should outperform common-sense rules and majority-class guesses.
  6. Check for leakage. Variables recorded after the target event must not be used to “predict” it.
  7. Inspect multiple metrics. Accuracy alone can conceal weak precision, recall, calibration, or rare-event performance.
  8. Examine both error types. False positives can label ordinary behavior as concerning; false negatives can miss important changes.
  9. Retest after changes. Promotions, interfaces, policies, products, and customer populations can shift relationships.
  10. Limit the claim. Treat predictions as signals for investigation, never as instructions for betting.

Fairness claims also deserve implementation evidence. In regulated settings, meaningful review can include RNG documentation, source-code checks, statistical output testing, game mathematics, platform versions, and independent test-house records. A screenshot of a certificate or a marketing statement should not substitute for checking what product and version were actually tested.

Responsible audit checklist for evaluating an online baccarat prediction model

Why Player Behavior Is Often More Predictable Than Baccarat Results

People react to wins, losses, streak displays, promotions, time pressure, and stories shared by other players. Across a sufficiently large group, those reactions can form recurring betting patterns even when individual decisions remain uncertain and game outcomes remain random.

Behavioral data may therefore estimate what groups are more likely to do under similar conditions. It does not establish that one person will place a particular bet, that a previous sequence causes the next result, or that market analysis creates a guaranteed edge. The predictable element is sometimes the human response to the display—not the cards behind it.

FAQ: Online Baccarat Market Data and Player Behavior

Can market data predict the next baccarat outcome?

Not reliably. It can describe historical distributions and player reactions, but regulated random-outcome systems are designed to prevent prior outputs from revealing the next result. Standards and implementations vary, so platform fairness should be verified rather than assumed.

Can online casinos predict player behavior?

They may estimate tendencies or risk indicators from account data. Those estimates are probabilistic and can be affected by bias, incomplete data, changing behavior, model drift, and an unclear target.

Does a Banker or Player streak prove the trend will continue?

No. A streak can influence what people choose, but it does not by itself prove that the next outcome will follow—or reverse—the sequence.

Is AI better than human analysis for baccarat data?

AI can process more records and detect complex associations, while human review supplies context and challenges misleading targets. Useful analysis needs both sound validation and careful interpretation.

What is the safest way to use baccarat data?

Use it to understand historical behavior, question platform claims, and support awareness and risk controls. It should not be treated as a promise of future wins or a reason to chase losses, increase stakes, or abandon personal spending and time limits.

Does Online Baccarat Market Data Really Predict Player Behavior?

It can predict aggregate tendencies within a defined setting, sometimes well enough to support research or flag a change worth reviewing. It cannot reliably reveal every individual’s next decision, and it does not transform historical streaks into future baccarat outcomes.

Market data is a lens, not a crystal ball. A responsible analyst asks whether the sample represents the target population, whether the prediction is defined before testing, whether it survives new data, and whether correlation is being mistaken for causation. The next time a dashboard presents a confident signal, will you ask what it truly predicted—and what it merely described?

Algorithmic Audits

Baccarat Bonus Wagering Requirement Audit: A Practical Verification Guide

Why does a bonus still show an unfinished requirement after substantial baccarat play? The cause may be the accepted-wager calculation, not the hands’ results. A Baccarat Bonus Wagering Requirement Audit compares the terms, bet history, contribution rate, bonus ledger and displayed balance. It tests whether rules were applied consistently; it does not improve odds or guarantee withdrawal.

The wagering requirement is the eligible turnover needed before release. A contribution rate is the percentage of a stake credited toward it. An eligible wager passes the stated rules, while the bonus ledger records credits, progress and reversals.

Baccarat bonus audit dashboard

What a Baccarat Bonus Wagering Requirement Audit Checks

Ask whether the target used the correct base, each stake earned the correct credit, and voids, refunds, expiry or withdrawal changed the ledger as stated. “Remaining wagering requirement” is only an output, not proof of the rules behind it.

In Britain, the UK Gambling Commission says reward systems tied to a current transaction or play session may count as remote gambling equipment. Its bonus and incentive guidance provides context, not a global rule or proof that one account is correct.

The Basic Wagering Requirement Formula

Required eligible wagering = applicable amount × wagering multiple
Accepted wager = stake × contribution rate

Bonus amount, deposit amount, or both?

Take the base from the original terms. In a hypothetical example, a $100 bonus at 20× creates a $2,000 target under a bonus-only rule. If a $100 deposit plus $100 bonus is subject to 20×, the target is $4,000. Neither model is a default.

Recalculate the remainder

Use remainder = initial target − cumulative accepted wagers. Five hypothetical $100 wagers at a stated 20% contribution add $20 each, or $100—not $500. The remainder against $2,000 is $1,900. Work in transaction order because a later void may reverse prior credit.

Flow for calculating eligible baccarat wagers

How Baccarat Contribution Rates Change the Result

Do not treat every position alike. Banker, Player, Tie and side bets may have different rates or exclusions. Live-dealer and RNG baccarat may differ, and promotion terms may override a general game list. Record the game ID, format and selection, then map each wager to the rule then in force.

Build a matrix by game and bet type showing rate, maximum stake, exclusions and effective dates. Mark gaps as unknown instead of assuming 100%, 20% or zero.

Audit the Transactions in Four Passes

Preserve the terms

Save the full terms, promotion page, message and timestamps. Capture the base, multiple, eligible games, rates, maximum bet, expiry timezone, withdrawal effects and cancelled-wager rule. A current page may differ from the accepted version.

Normalize the bet history

Keep transaction ID, UTC time, game and table ID, live or RNG format, selection, stake, status and linked reversal. Separate cash and bonus balances. Win or loss does not reveal contribution.

Recalculate eligible turnover

Test eligibility, stake limit and timing, then apply the documented rate. Sum credits in order and subtract reversals. If rounding is unclear, calculate per-bet and aggregate versions and flag the difference.

Reconcile the ledger

Compare expected credit, actual progress and variance. Match awards, settlements, refunds, expiry and forfeiture by ID and time. A variance limited to one bet type suggests mapping; one after a refund suggests reversal handling.

Four-column comparison table of bonus audit data

Common Errors and False Alarms

  • Contribution mismatch: the engine uses a rate different from the saved terms.
  • Void or refund: a stake is properly reversed, omitted, or reversed twice.
  • Maximum bet: a cap breach has the stated consequence.
  • Expiry or withdrawal: progress resets or funds are forfeited.
  • Wallet routing: cash and bonus funds follow a particular priority.

A loss is not evidence of an error. Results change the balance, house edge describes probabilistic expectation, and contribution rules change credited turnover. An audit does not change baccarat probability.

Document a Disputed Calculation

Keep the accepted terms, timestamps, account and promotion IDs, original export, calculation sheet and variance table. For each disputed row, show the applicable rule, expected credit, observed credit and difference. Request the contribution table, rounding method, timezone and reversal reason without alleging intent.

Regulation Is Jurisdiction-Specific

UK example: the Commission’s remote gambling testing strategy covers risk-based testing and independent assurance in some circumstances. It supports disciplined verification but does not certify an individual calculation or decide a dispute.

Licensing rules, complaint routes and disclosure duties vary. Identify the licence and rules governing the account on the relevant date; never treat a British requirement as global.

Final Baccarat Bonus Wagering Requirement Audit Checklist

  • Confirm the terms, version, acceptance time and jurisdiction.
  • Identify the base and recompute the target.
  • Map each game and bet type to its contribution.
  • Test limits, exclusions, expiry, withdrawal and wallet rules.
  • Match bets to settlements, voids, refunds and reversals.
  • Rebuild the ledger and document rounding.
  • Compare calculated progress with the displayed remainder.
  • Escalate explained variance with transaction evidence.

The key sequence is original terms → bet logs → contribution rate → bonus ledger → remaining requirement. This makes a Baccarat Bonus Wagering Requirement Audit reproducible. It may reveal inconsistent application or missing data, but cannot improve odds, recover losses or promise withdrawable funds.

Quantitative Research

Baccarat Sample Size Calculation for Statistical Analysis

How many baccarat records are enough for a statistically useful analysis? There is no universal hand count. The answer depends on the outcome, acceptable uncertainty, confidence level, statistical power, and structure of the data. Baccarat Sample Size Calculation for Statistical Analysis is a research-design task—not a betting system or a way to predict the next hand.

What Does Sample Size Mean in Baccarat Statistical Analysis?

A hand, or coup, is the smallest event, but it is not automatically the right observation unit. Hands are nested within shoes, while shoes may be nested within sessions, tables, platforms, or players. For research about session behavior, the session may be the unit. For shoe-level procedures, the number of shoes matters more than the raw number of hands.

Duplicates and related observations create false precision when treated as independent. Player-provided logs can also favor memorable sessions over ordinary ones. Before calculating n, define what one row represents, its source and inclusion rules, and whether rows share conditions.

Hierarchical observation units: hands, shoes, and sessions

Define the Statistical Goal Before Calculating Sample Size

Estimating a mean

Means may include average stake, session length, recorded return, or loss per session. If the population standard deviation is treated as known, a common sample size formula is:

n = (z × σ / E)2

Here, n is the required number of independent observations, z is the confidence-level critical value, σ is the assumed standard deviation, and E is the margin of error. For a two-sided 95% interval, z is approximately 1.96. The NIST guidance for estimating a mean explains this inverse-square relationship and the roles of alpha, beta, variability, and the difference of interest.

If σ is unknown, estimate it from a pilot or relevant earlier study, record the rationale, and consider an iterative t-distribution calculation. Testing several plausible values is safer than depending on one unstable pilot estimate.

Estimating a proportion

Proportions can describe records in a coded outcome category, sessions containing a defined behavior, or occurrences of a specified event. A basic confidence-interval approximation is:

n = z2 × p(1 − p) / E2

In this equation, p is the expected proportion. If no pilot estimate exists, p = 0.5 is a conservative general assumption because it maximizes p(1 − p). It is not a claim about baccarat outcome probabilities.

Testing a difference or effect

A hypothesis test also requires alpha, the false-positive risk; beta, the false-negative risk; statistical power, equal to 1 − beta; and the smallest effect size worth detecting. Smaller effects normally require more data. The NIST method for testing proportions uses the null and alternative proportions, significance level, power, and difference to detect.

Flowchart for choosing sample size by research goal

How Confidence Level and Margin of Error Change the Sample

Common two-sided z values are about 1.645 for 90%, 1.96 for 95%, and 2.576 for 99%. With all other inputs fixed, higher confidence increases the required sample. Because E is squared, halving the margin of error requires roughly four times as many independent observations.

“95% confidence” describes the long-run performance of an interval procedure under its assumptions. It does not mean the next hand has a 95% chance of any outcome. The baccarat gambler’s fallacy provides related background on why short runs should not be interpreted as forecasts.

Sample size curves by confidence level and margin of error

Worked Examples for Baccarat Data Analysis

An illustrative proportion study

Suppose a researcher codes a binary session characteristic and expects p = 0.30. At 95% confidence with E = 0.03, n = 1.962 × 0.30 × 0.70 / 0.032 = 896.37. Round up to 897 independent sessions. This is an illustrative method example, not a win-rate estimate. Different definitions, collection methods, and clustering assumptions change the requirement.

An illustrative mean study

A pilot estimates the standard deviation of session length as 18 minutes. To estimate the mean within 3 minutes at 95% confidence, n = (1.96 × 18 / 3)2 = 138.30, so round up to 139 independent sessions. If 10% of records may be unusable, divide by 0.90 and round up to 155 collected sessions. This allowance anticipates exclusions; it does not correct biased sampling.

Why More Records Do Not Guarantee Better Evidence

  • Dependence: Hands in one shoe or session may share conditions. Consider cluster-level analysis, a design effect, cluster-robust methods, or an appropriate bootstrap.
  • Selection: Submitted histories may overrepresent unusual outcomes. Define sources and inclusion rules in advance.
  • Mixed environments: Online RNG logs, live-dealer streams, and physical-shoe records differ in generation, auditing, timing, and missing-data processes. Pool them only with a documented justification.
  • Repeated testing: Testing many outcomes, periods, or subgroups increases false-positive risk. Pre-specify primary analyses or adjust for multiple comparisons.

Audit timestamps, identifiers, duplicates, rule variants, and missing fields. Physical and live-dealer research may also require a separate review of shuffle integrity and data provenance.

A Practical Sample Size Planning Checklist

  1. State the primary question and outcome variable.
  2. Choose the unit: hand/coup, shoe, session, player, or table.
  3. Set the confidence level or alpha and specify one- or two-sided testing.
  4. Set the margin of error or minimum detectable effect.
  5. Justify σ or p using pilot data, prior research, or a conservative range.
  6. Choose the target power and account for clustering.
  7. Add a documented allowance for missing, excluded, or invalid records.
  8. Predefine platforms, collection dates, stopping rules, and analysis methods.

Common Sample Size Mistakes

Do not assume that 1,000 or 10,000 hands is always enough, that a large sample removes bias, or that every logged hand is independent. Avoid treating a short streak as long-run evidence, selecting favorable results after seeing the data, or presenting an example calculation as a profit guarantee. Precision applies only to the population and research design that were actually defined.

Final Takeaway

Baccarat Sample Size Calculation for Statistical Analysis has no fixed baccarat number. A defensible sample depends on the objective, outcome, analysis unit, variability or expected proportion, margin of error, confidence level, power, effect size, and dependence structure. Calculate it before collection, round upward, add a documented quality allowance, and validate the data pipeline. Sample-size planning reduces uncertainty; it cannot predict the next result or guarantee gambling profit.

Blog

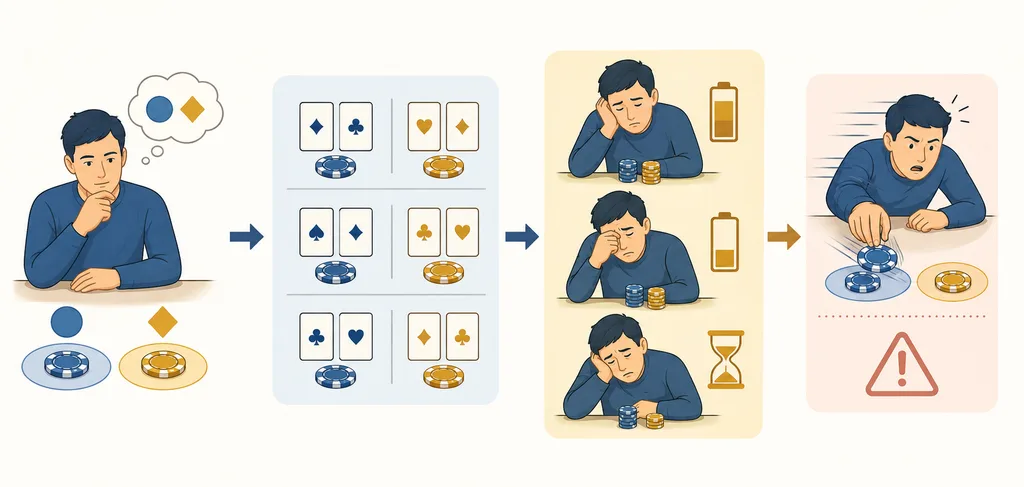
Baccarat Decision Fatigue and Betting Errors: Why Long Sessions Distort Judgment

Baccarat presents only a few main betting choices, yet repeating those choices through a long session can change how they are made. A player who began with a fixed stake may start betting faster, raising amounts after losses, or treating the scoreboard as a prediction. Baccarat decision fatigue does not determine the next result; it describes a possible decline in the consistency and control of the player’s decision process.

What matters most during a long session

  • Fatigue can affect attention, patience, and adherence to a plan without changing the cards.
  • Banker, Player, and Tie retain their mathematical characteristics regardless of a player’s mental state.
  • Faster bets, improvised stake increases, and rewritten limits are observable process warnings.
  • Breaks create time between an impulse and an action; they do not improve the probability of winning.
A tired baccarat player beside a clock, chips, and an electronic scoreboard

What Is Baccarat Decision Fatigue?

Decision fatigue is best used here as a behavioral framework, not a diagnosis or a fixed biological rule. It refers to the possibility that sustained mental effort makes later choices less consistent, more automatic, or more sensitive to immediate emotion. It should not be assumed that every long-session player experiences the same effect at the same time.

A PLOS ONE experiment on cognitive fatigue and economic decisions compared young university participants who completed 60–90 minutes of demanding cognitive work with a control group. Fatigue did not produce a reliable directional shift in risk preferences; it increased variability across several measures. The experiment was not a baccarat study, so its value is limited to illustrating how consistency may become less stable under cognitive strain.

Why simple choices become mentally expensive

Repetition, fast feedback, and automatic responses

The choice between Banker, Player, and Tie is mechanically simple. The surrounding task is not. A player tracks money, session time, previous outcomes, emotions, and whether current behavior still matches the original plan. Rapid hand resolution leaves little space for that review. Repetition can turn a deliberate selection into a reflexive click or chip placement, especially when attention is divided.

Losses and scoreboard pressure

A run of losses can shift the objective from following a limit to recovering money immediately. At the same time, a scoreboard gives random sequences a vivid visual shape. It records previous results, but it does not establish that Player or Banker is “due.” This error is examined further in our guide to the gambler’s fallacy in baccarat. Scoreboards can organize history; they cannot guarantee the next outcome.

Flow from a planned baccarat decision to a fatigue-related betting error

How fatigue can produce betting errors

Fatigue does not force one specific bet. It can instead weaken the boundary between an impulse and an action. One player may increase the stake without a pre-set reason; another may abandon a planned Banker or Player choice because a streak looks persuasive. A third may use an emotional Tie bet as an attempted shortcut to recovery despite its substantially higher house edge.

Common process errors include rounding a normal stake upward, placing the next bet before reviewing the last one, adding funds after reaching a loss limit, and redefining “one final hand” several times. These behaviors fit broader baccarat player behavior analysis. They are warning signals rather than proof that a person has a disorder.

Loss chasing deserves particular attention because the goal silently changes. The player is no longer deciding whether a wager fits the plan; the player is trying to erase an uncomfortable result. Fatigue may make that emotional reframing harder to notice, particularly when combined with loss aversion in high-variance decisions.

The mathematics does not become fatigued

Standard betApproximate house edgeWhat fatigue changes
Banker1.06%Potentially the player’s stake discipline, not the underlying edge
Player1.24%Potentially the reasoning process, not the next-hand probability
Tie14.36%Potentially susceptibility to an emotional high-payout choice

These commonly cited figures assume standard rules and payouts; variants can differ. Our baccarat house edge guide explains the calculations in more detail. Banker’s comparatively low edge does not remove the casino’s long-run advantage, and it is not a winning system. Rest, confidence, experience, and scoreboards cannot alter the fixed rules of a hand.

Comparison table showing the approximate house edges of Banker, Player, and Tie bets

Signs that betting judgment is slipping

  • The interval between results and new bets is becoming noticeably shorter.
  • Stake sizes are changing without a reason written before the session.
  • Past outcomes are being described as proof that one side must appear next.
  • A financial or time limit is being renegotiated only after it has been reached.
  • Irritation, urgency, or a need to “get even” is replacing the original plan.
  • Basic details such as current loss, elapsed time, or recent stake size are hard to recall.

One sign alone does not diagnose a problem. A cluster of changes, however, is a practical reason to stop rather than test whether discipline will return during the next hand.

Do breaks reduce baccarat betting errors?

A break is useful because it interrupts automatic responding. In a study of 74 adult gamblers using an electronic gaming task under sustained losses, a standard break and an active stop-signal intervention increased response latency. The interventions did not significantly reduce gambling persistence. The Current Psychology study therefore supports a narrow conclusion: an interruption can create more time before the next bet, not a promise that play will stop or outcomes will improve.

An active break means leaving the betting interface, checking elapsed time and money against the original limits, and deciding away from the next-deal countdown. Its purpose is to restore deliberation. It does not make Banker more likely, reset randomness, or improve win rate.

A practical anti-fatigue framework

  1. Set limits before play. Record a maximum duration, loss amount, and fixed betting unit while no recent result is influencing the decision. Treat them as exit rules, not targets.
  2. Use time checkpoints. Set alarms at fixed intervals and take a genuine off-screen or away-from-table break. Do not wait until frustration is obvious.
  3. Write the reason before the stake. If the amount differs from the base unit, record why. “Recover the last loss” and “this side is due” are stop signals, not valid mathematical reasons.
  4. Stop on process signals. End the session for repeated rushed bets, forgotten totals, limit bargaining, or emotional Tie selections even if the financial ceiling has not been reached.

These controls complement ordinary bankroll management in baccarat, but no budget makes gambling profitable or risk-free. If limits are repeatedly overridden, chasing continues, or gambling is causing financial or emotional harm, the appropriate next step is to stop and use local responsible-gambling or self-exclusion support.

Fatigue changes the player, not the game

Baccarat decision fatigue is useful because it directs attention to observable behavior: speed, stake changes, limit revisions, and reasoning based on “due” outcomes. It should not be used to diagnose every long session or explain every loss. The cards and house edge remain unchanged. The protective goal is simpler—preserve enough distance between feeling an impulse and acting on it, and end the session when that distance is disappearing.

Algorithmic Audits

Baccarat Game History Log Integrity Audit: A Practical Framework

Even when game outcomes appear fair, incomplete records make reliable after-the-fact verification impossible. A Baccarat Game History Log Integrity Audit asks whether each hand can be reconstructed from preserved evidence—not whether its outcome looks sufficiently random.

The audit focuses on missing events, duplicates, unauthorized changes, sequence errors, timestamp conflicts, and broken links between gameplay and settlement. It gives operators, auditors, and analysts a repeatable way to assess the evidence without turning every anomaly into an allegation of manipulation.

What Is a Baccarat Game History Log Integrity Audit?

A Baccarat Game History Log Integrity Audit evaluates five properties: completeness, consistency, authenticity, traceability, and availability. A complete log contains the events needed to reproduce a hand. Consistent records agree across systems. Authentic records retain credible evidence of origin and change. Traceable records connect actions to identities and versions. Available records can be retrieved throughout the applicable retention period.

This is different from RNG testing, which examines random-number generation, and from outcome-distribution testing, which searches for statistical anomalies. Settlement verification asks whether balances and payouts were calculated correctly. Log integrity comes first because every later test depends on the reliability of its input data.

Baccarat event, result, settlement, and audit trail flow

Why Game History Logs Need an Integrity Audit

A record may exist yet still be unsuitable for an investigation. A displayed result could omit an interrupted attempt, while a settlement table could contain a payment with no matching hand. Such gaps complicate dispute resolution, incident analysis, internal control testing, and reproducible research.

The central question is practical: can an independent reviewer follow one hand from initiation through cards, outcome, settlement, and final status? If the answer depends on undocumented assumptions or editable screenshots, the evidence is weak even when the visible result is plausible.

What a Complete Baccarat Game Log Should Contain

Each hand should have a unique hand ID linked to a session, table or game instance, account reference where appropriate, rule set, software version, and event sequence. Time fields should include a consistent time standard or explicit time-zone metadata, along with enough precision to order closely spaced events.

The reconstruction set normally includes accepted bets, card values and dealing order, Player and Banker totals, applied drawing decisions, outcome, payout calculation, settlement amount, currency, and final status. Void, cancelled, retried, interrupted, reversed, and incomplete states require explicit flags and reasons rather than silent deletion.

Keep the raw event stream, player-facing history, and financial settlement record logically distinct. They describe different layers and should reconcile through stable identifiers. Database audit logs serve another purpose: they show who changed, deleted, exported, or administered stored data rather than documenting the game itself.

A Practical Integrity Audit Workflow

  1. Define the population. Record the systems, tables, game versions, jurisdictions, time window, exclusions, retention rules, and extraction method being tested.
  2. Test structure and sequence. Search for missing IDs, duplicate keys, gaps in event sequences, impossible state transitions, and events recorded after settlement.
  3. Reconcile independent layers. Join game events to visible results, settlements, account entries, reversals, and dispute records using hand and transaction IDs.
  4. Compare preserved copies. Match primary data against backups, exports, replicas, or other independently maintained copies where available.
  5. Review change evidence. Examine clock synchronization, software releases, administrator access, correction jobs, deletions, and reprocessing activity.

Useful measures include the missing-record rate, duplicate rate, orphan settlement count, sequence-inversion count, timestamp-conflict rate, and status-mismatch rate. Row totals alone are insufficient because equal counts can conceal replaced or duplicated hands.

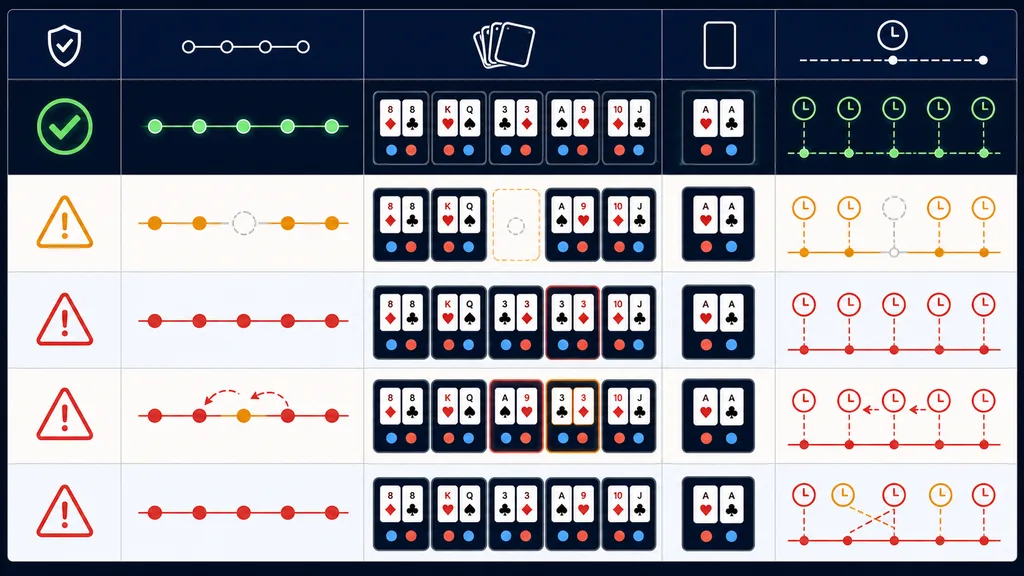
Comparison of normal baccarat logs and logs with missing, duplicate, and out-of-order events

How Missing, Altered, or Duplicated Records Are Detected

Missing-record indicators include unexplained ID gaps, settlements without hands, hands without terminal status, or missing events between bet acceptance and result publication. Duplicate indicators include repeated hand IDs, identical event payloads under new IDs, and multiple settlements for one final state.

Possible post-event modification indicators include hashes that no longer match, updates outside an approved correction workflow, version fields that conflict with deployment history, or administrator activity close to deletion or export events. Hash chains, append-only designs, WORM storage, access logs, and immutable backups can strengthen tamper evidence, but no single technology provides absolute integrity or is universally mandated.

An illustrative example is a hand marked completed at 14:05:12, followed by a card event stamped 14:05:18 and two payout rows. That pattern warrants checking clock behavior, retry logic, and transaction idempotency. It does not by itself prove deliberate alteration.

Statistical Checks Are Useful but Not Sufficient

Outcome frequencies, runs, and distribution tests can identify data that deserves review. They cannot establish that the underlying history is complete or unchanged. Selective retention may bias the sample before any test begins, while a storage defect may create unusual frequencies without affecting the original gameplay.

A p-value is not the probability that manipulation occurred. It measures how compatible a chosen statistic is with a specified model under stated assumptions. Auditors should therefore treat statistics as a supporting layer after population definition, sequence testing, and reconciliation.

What Public Guidance Emphasizes

Requirements vary by jurisdiction, licence, product, and system type. The UK Gambling Commission’s casino equipment requirements discuss audit trails for financial transactions and significant events, regular backups, information sufficient to reconstruct previous play, accurate timestamps, and preservation of relevant historical data during disputes. These are jurisdiction-specific requirements, not universal rules. See the Commission’s electronic device and server-based system requirements.

For a broader security perspective, NIST SP 800-92 presents enterprise guidance for developing and maintaining log-management infrastructure and processes. It is useful as a general framework, not as baccarat-specific regulation.

Baccarat Log Integrity Checklist

  • The audit period, population, exclusions, and retention basis are documented.
  • Every hand has a unique ID linked to session, table, rules, and software version.
  • Timestamps, precision, time zones, and event ordering are consistent.
  • Bets, cards, totals, outcomes, payouts, and final states are reproducible.
  • Voids, cancellations, interruptions, retries, and reversals remain visible.
  • Missing, duplicate, orphaned, and out-of-order records are measured.
  • Primary logs are compared with backups or independent records.
  • Changes, deletions, privileged access, and remediation retain evidence.
  • Exceptions are reproduced, investigated, and assigned a resolution status.
Baccarat log integrity assessment checklist

How to Interpret Findings Responsibly

An integrity exception is not automatically proof of manipulated results. A missing hand may arise from an extraction boundary, service interruption, integration failure, clock drift, or faulty retry process. Investigation should first reproduce the issue and compare independent sources.

Repeated patterns confirmed across separate records justify greater scrutiny, especially when they coincide with unexplained access or correction activity. The report should distinguish what was tested from what was not tested and state the sample size, limitations, evidence, likely cause, operational impact, and remediation status.

Frequently Asked Questions

Does a complete history prove baccarat is fair?

No. Completeness supports reconstruction, but fairness requires separate review of game rules, software behavior, randomness where applicable, and settlement logic.

Can duplicate records change an audit result?

Yes. Duplicates can inflate counts, distort distributions, and create false settlement mismatches. Auditors should identify whether duplication occurred during gameplay, storage, export, or reprocessing.

How long should records be retained?

There is no universal period. The applicable regulator, licence conditions, dispute policy, legal obligations, and system risk should determine retention and preservation rules.

Does one missing hand prove manipulation?

No. It proves that the tested record set has an exception requiring explanation. A credible conclusion depends on cause analysis, corroborating evidence, and repeatability.

A Baccarat Game History Log Integrity Audit is not a tool for confirming suspicion or predicting future hands. It is a disciplined process for evaluating whether reproducible evidence exists, where that evidence breaks, and how confidently later reviews can rely on it.

Algorithmic Audits

Baccarat Statistical Randomness Test: Methods, Evidence, and Audit Limits

Do long banker streaks or tie droughts prove that baccarat is not random? No. Randomness does not require every short session to look balanced, and genuine random sequences can contain clusters, gaps, and striking alternations. A Baccarat Statistical Randomness Test replaces visual impressions with a defined model, a frozen dataset, and tests selected before the results are examined.

A failed statistical test is a signal for investigation, not automatic proof of manipulation.

바카라 결과 로그와 통계 검정 대시보드

What Is a Baccarat Statistical Randomness Test?

A randomness test asks whether observed output is compatible with a specified random model. Its null hypothesis might state that outcome frequencies follow the probabilities produced by the documented baccarat rules, or that consecutive outcomes satisfy an independence assumption. The test does not begin with the claim that a system is fair or fraudulent.

The model must reflect the actual variant: deck configuration, drawing rules, card replacement or shoe handling, burn procedures, and the way raw random numbers are converted into cards. Using generic probabilities for a different implementation can manufacture an apparent anomaly.

What Data Should Be Tested?

Outcome frequencies and game details

Banker, player, and tie counts are an accessible starting point, but an audit should retain more detail when available. Final totals, cards drawn per hand, natural outcomes, pair categories, shoe boundaries, timestamps, software versions, and voided rounds help identify where a deviation enters the process. Exclusions must be documented rather than chosen after viewing the results.

Raw output, mapped cards, and displayed results

Raw RNG values, scaled values, shuffled-deck positions, resolved hands, and player-facing outcomes are separate audit layers. A raw stream may pass tests while biased scaling or faulty game logic changes the final distribution. Conversely, a result log alone cannot reveal weak seed generation or duplicated internal streams. Reviews of seed entropy and shuffle integrity therefore complement outcome analysis.

RNG 출력에서 바카라 결과까지의 계층도

The Main Tests Used in Baccarat Audits

Chi-square goodness-of-fit

This test compares observed and expected counts across predefined categories. It can examine banker, player, and tie frequencies, card-count groups, or final-total bands. Categories need adequate expected counts; sparse groups may require combination or a simulation-based method. The question answered is whether the overall discrepancy is larger than the model would ordinarily produce.

Runs tests

A run is an uninterrupted sequence of the same classified result. Runs tests examine whether there are unusually many or few runs, or unusual clustering, relative to the chosen model. They are useful for investigating streak claims, but a long banker run is not by itself evidence of interference.

Serial correlation and transitions

Serial correlation asks whether values separated by one or more positions move together unexpectedly. Transition analysis compares patterns such as banker-to-player or player-to-player against conditional expectations. These methods can expose dependencies that a frequency table misses, although shoe structure and rule-driven dependence must be represented correctly.

Distribution comparisons

A Kolmogorov–Smirnov test can compare suitable ordered or continuous outputs with a reference distribution. Baccarat outcomes are often discrete, so its standard calibration may not apply directly. Exact, permutation, or simulated reference distributions may be more appropriate. The test should fit the data, not merely appear in a checklist.

관측 빈도와 기대 빈도의 비교 막대그래프

How to Interpret P-Values

A p-value is not the probability that manipulation occurred. It measures how unusual the observed statistic would be if the null hypothesis and its assumptions were true. An analysis should define its significance level in advance and report the statistic, p-value, effect size, uncertainty, and sample size together.

Running many tests increases the chance that at least one result appears significant by accident. Auditors should pre-register test families and thresholds, apply an appropriate multiple-testing correction, and distinguish exploratory findings from confirmatory results. Statistical significance also does not establish practical importance.

Why Sample Size Changes the Answer

A short log has limited power: it may contain dramatic-looking streaks while being unable to detect a meaningful bias reliably. A very large dataset can identify a tiny deviation that has little operational consequence. Sample-size planning should specify the smallest relevant effect, desired power, category rarity, dependence structure, and whether observations span independent shoes, servers, seeds, or time periods.

A Practical Randomness Testing Workflow

  1. Define the system. Record the rules, RNG version, mapping process, platform, and expected mathematical model.
  2. Freeze the data. Hash or otherwise preserve the extract, establish its time range, and document missing, voided, duplicated, or excluded records.
  3. Pre-register the analysis. Select frequency and sequence tests, significance levels, corrections, and escalation criteria before inspecting test outcomes.
  4. Validate the pipeline. Confirm parsing, category labels, ordering, shoe boundaries, and expected-value calculations with controlled examples.
  5. Run and diagnose. Examine effect sizes and residuals to locate the category, period, or layer responsible for a failure.
  6. Replicate independently. Test a new period or separately generated stream. Review code, configuration, seed handling, scaling, and operational logs if the anomaly persists.

The UK Gambling Commission’s RTS 7 requirements connect statistical evidence with expected distributions, unpredictability, stream repetition, seeding, scaling, and correct mapping. That broader scope is why a credible audit is more than a chart of hand outcomes.

What a Failed Test Does—and Does Not—Prove

A failure may arise from chance, a wrong reference model, corrupted extraction, unrecorded rule changes, dependence between samples, implementation defects, or deliberate interference. One result cannot identify the cause. Findings are better classified as “within the expected range,” “more data required,” “independent replication required,” or “implementation and operational review required.”

Passing tests is also limited evidence. As NIST SP 800-22 explains, statistical testing is a useful first step but cannot absolutely certify a generator for a particular use or replace cryptanalysis. Passing an outcome test does not establish secure entropy, computational unpredictability, correct deployment, or resistance to attackers.

Audit Checklist

  • Document rules, versions, data provenance, time range, and exclusions.
  • Separate raw RNG, scaling, shuffle, game logic, and displayed outcomes.
  • Calculate expectations from the correct baccarat model.
  • Use both frequency and sequence-sensitive tests.
  • Report sample size, assumptions, effect sizes, p-values, and corrections.
  • Replicate anomalies on independent data and investigate implementation.
  • State what the evidence cannot establish.

Frequently Asked Questions

Does a long banker streak indicate a biased RNG?

Not on its own. The relevant evidence is the streak’s frequency under a correctly specified model, evaluated within a preplanned analysis and an adequate sample.

Does passing every selected test prove fairness?

No. It shows that the tested data did not contradict the tested assumptions at the chosen sensitivity. Source code, mapping, seeds, security controls, change management, and live operations remain separate concerns.

Can randomness testing predict the next hand?

No. These tests assess historical compatibility with a model; they are not betting systems and do not remove the house edge.

Statistical testing is one layer of fairness assessment. A defensible baccarat audit states exactly which data, model, implementation, and operating period were examined—and treats unexplained anomalies as questions to replicate and investigate, not instant verdicts.

Behavioral Studies

Baccarat Anchoring Bias: How Initial Bets Influence Later Decisions

Baccarat Anchoring Bias: How Initial Bets Influence Later Decisions starts with a simple problem: the first meaningful number at the table can become a mental reference point. A player who opens with $50 may soon regard $50 as “normal,” even when a smaller stake better fits the budget. An early win or loss can create the same pull. That influence is psychological, not evidence about the next hand.

첫 베팅 칩이 이후의 판단 기준이 되는 바카라 테이블

Baccarat Anchoring Bias: How Initial Bets Influence Later Decisions

Anchoring bias means giving too much weight to a starting value or narrow slice of information. The NCBI Bookshelf overview of cognitive biases describes anchoring as reliance on one fact or a small share of available facts, which can block other relevant information.

In baccarat betting psychology, the anchor may be an opening stake, first result, displayed payout, or another player’s wager. Genuine statistical evidence must be relevant, supported by suitable data, and interpreted within the rules. A number is not evidence merely because it is vivid.

How initial bets become reference points

Bet amount as a numerical anchor

Suppose a player chooses $40 for the first wager without much thought. Soon, $10 may feel “too small” only because $40 established the comparison. The initial bet influence has changed the perception of an appropriate stake—not the player’s limits or the game.

The first result as a narrative anchor

An opening win may make a larger second wager feel justified. An opening loss may make the original stake feel like an amount that must be matched. Either way, one result can dominate baccarat decision-making despite being a tiny sample.

초기 결과에서 베팅 변경으로 이어지는 앵커링 편향 흐름도

How anchoring changes later choices

After an early win, a player might increase from $20 to $40 because the original amount now feels conservative. After a loss, the same player might keep wagering $40 because stepping down feels like accepting defeat. Neither choice proves anchoring alone. The warning sign is that the first number remains influential after its rationale has vanished.

Related biases are distinct. Confirmation bias favors supportive information. The gambler’s fallacy expects past random results to create a correction. Loss chasing adds risk after losses, while sunk-cost thinking overvalues money already committed. These patterns can overlap with anchoring.

What anchoring bias cannot do

Past hands do not control the next result

A personal win, loss, chosen stake, or visible streak does not cause the next hand to “owe” a Banker, Player, or Tie result. The dealing rules determine probabilities. Recent results may feel informative, but feelings do not change the mechanism of play.

An anchor is not a prediction

An anchor can alter confidence or bet size; it cannot forecast the next hand. Changing stakes changes the amount exposed, not the advantage built into the offered bets. No progression turns past outcomes into predictive evidence or removes the house edge. Treat baccarat as paid entertainment, never as income.

What research can reasonably support

Anchoring is documented as a general feature of judgment under uncertainty, making it a useful lens for cognitive bias in baccarat. Yet research in other settings does not prove every baccarat player behaves identically. Experience, emotion, fatigue, and table conditions can affect choices.

Practical safeguards at the table

  • Set the unit in advance. Choose an affordable fixed stake from an entertainment budget, not from the first result.
  • Predefine money and time limits. Write them down; do not expand them because play began well or badly.
  • Pause before changing size. Wait after a large win, loss, or emotional hand.
  • Check several facts. Compare the stake with the budget, session plan, and reason for playing.
  • Keep a record. Note the amount, reason, emotion, and whether the choice followed the plan.

A disciplined choice can lose, and an impulsive choice can win. Judge the process separately from one outcome so that outcome does not become false proof.

심리적 앵커와 독립 확률, 사전 계획을 비교한 그래픽

A five-question self-check

  1. Would I choose this amount if the first hand had not happened?
  2. Am I following my written plan or reacting to a vivid number?
  3. Has my reason changed, or only my emotion?
  4. Would a short break make this choice easier to explain?
  5. Is the wager affordable even if it loses?

If an answer is unclear, pause or stop. This check does not improve winning chances; it separates an intentional entertainment decision from an automatic reaction.

Frequently asked questions

Can the first bet affect the next hand?

It can influence thinking, but it cannot physically alter the next result.

Is changing bet size after a win always anchoring?

No. It may be preplanned. Concern arises when an early result overrides the budget or written rules.

Does a losing streak justify a larger wager?

No streak guarantees a reversal. A larger stake increases exposure and may reflect loss chasing, anchoring, or both.

Keep the reference point outside the game

The safest reference point is a limit chosen before emotion and recent results enter the picture. Baccarat Anchoring Bias: How Initial Bets Influence Later Decisions explains why an opening stake can shape judgment, not how to predict cards. Keep gambling optional, use firm money and time limits, and take breaks. If play becomes difficult to control or causes financial or emotional harm, stop and seek qualified responsible-gambling support in your region.

Behavioral Studies

Baccarat Overconfidence Bias: 바카라 과신 편향이 베팅 판단을 흔드는 방식

바카라에서 3번 연속 맞힌 뒤, 다음 베팅이 유난히 쉬워 보인 적이 있는가? 방금 전까지의 선택이 맞았다는 사실은 기분 좋은 경험이지만, 그 감각이 “나는 이 테이블을 읽고 있다”는 확신으로 바뀌는 순간 판단은 흔들릴 수 있다. Baccarat Overconfidence Bias는 플레이어가 자신의 예측 능력, 패턴 해석 능력, 판단 정확도를 실제보다 높게 평가하는 경향을 뜻한다.

이 글은 바카라에서 과신이 왜 자연스럽게 생기는지, illusion of control, confirmation bias, gambler’s fallacy, loss chasing과 어떻게 연결되는지, 그리고 베팅 금액을 키우기 전 어떤 점검이 필요한지를 행동경제학과 도박심리 관점에서 설명한다. 목적은 “더 잘 맞히는 법”이 아니라 위험한 판단 왜곡을 줄이는 것이다.

바카라 스코어보드를 바라보는 플레이어와 과신 편향 신호

What Is Baccarat Overconfidence Bias?

과신 편향은 자신의 능력과 판단을 실제보다 낫다고 평가하는 일반적인 인지 경향이다. 심리학에서는 overconfidence를 판단의 정확성에 대한 지나친 확신으로 설명하며, 도박 상황에서는 이 확신이 확률보다 감정과 기억에 더 강하게 기대게 만든다.

바카라 맥락에서는 “다음 coup를 읽을 수 있다”, “banker 흐름을 잡았다”, “이 shoe는 player가 돌아올 차례다” 같은 느낌으로 나타난다. 문제는 이런 말이 늘 비합리적이라서가 아니다. 몇 번의 결과가 실제로 맞아떨어지면 뇌는 그것을 우연보다 능력에 가깝게 해석하기 쉽다.

하지만 바카라의 각 결과는 제한된 규칙 안에서 발생하는 확률 사건이다. 플레이어가 과거 결과를 관찰할 수는 있어도, 그 관찰이 다음 hand를 통제한다는 뜻은 아니다. 과신은 바로 이 경계가 흐려질 때 생긴다.

왜 바카라에서는 과신이 합리적으로 느껴질까?

짧은 연승은 실력처럼 느껴진다

바카라는 규칙이 단순하고 결과가 빠르게 반복된다. banker와 player 중 하나를 고르고, 결과가 나오고, 다시 선택한다. 이 속도는 짧은 시간 안에 여러 번의 성공 경험을 만들 수 있다. 4번 중 3번을 맞히면 “오늘 감이 좋다”는 생각이 자연스럽게 든다.

그러나 단기 성과는 분산의 영향을 크게 받는다. 짧은 구간에서는 운이 실력처럼 보이고, 실수도 단순한 예외처럼 보인다. 과신은 대개 장기 기록이 아니라 최근 기억에서 출발한다.

스코어보드는 패턴 확신을 강화한다

바카라 로드맵과 스코어보드는 과거 결과를 시각적으로 보여준다. 줄, 반복, 끊김, 긴 streak는 마치 설명 가능한 구조처럼 보인다. 인간의 뇌는 무작위적 정보에서도 패턴을 찾도록 설계되어 있기 때문에, 이러한 시각 자료는 확신을 키우기 쉽다.

스코어보드가 아무 가치도 없다는 뜻은 아니다. 그것은 과거 결과를 정리해 보여주는 도구다. 다만 과거 결과가 미래 결과를 직접 보장한다고 해석하는 순간 문제가 된다. 장기 확률과 단기 관찰의 차이는 Bayesian convergence in baccarat 같은 관점에서 더 차분하게 이해할 수 있다.

낮은 하우스 엣지는 예측 가능성을 뜻하지 않는다

바카라는 카지노 게임 중 핵심 베팅의 하우스 엣지가 비교적 낮은 편으로 알려져 있다. Wizard of Odds의 8-deck baccarat return table 기준으로 banker bet의 house edge는 약 1.06%, player bet은 약 1.24%, tie bet은 약 14.36%로 제시된다. 자세한 수치는 Wizard of Odds baccarat basics에서 확인할 수 있다.

중요한 점은 낮은 house edge가 “플레이어가 다음 결과를 예측할 수 있다”는 뜻이 아니라는 것이다. 그것은 장기적으로 불리한 정도가 상대적으로 작다는 의미에 가깝다. banker만 고르면 안전하다는 뜻도 아니다. banker 역시 하우스 엣지가 있으며, 장기 구조는 여전히 플레이어에게 불리하다.

바카라 Banker Player Tie 하우스 엣지 비교 표

과신한 바카라 판단 뒤에 있는 심리

Illusion of Control

Illusion of control은 무작위적이거나 확률적인 환경에서 자신이 결과에 영향을 준다고 느끼는 경향이다. 바카라에서는 딜러, 테이블 분위기, 카드가 나오는 리듬, shoe의 흐름, 다른 플레이어의 선택이 통제 단서처럼 해석될 수 있다.

물론 관찰 자체가 문제는 아니다. 위험은 관찰이 통제감으로 바뀔 때 생긴다. “내가 기다렸기 때문에 맞았다”, “방금 끊었기 때문에 다음도 읽을 수 있다”는 식의 해석은 실제 확률보다 자기 역할을 크게 만든다.

Confirmation Bias

Confirmation bias는 자신이 믿고 싶은 정보는 크게 기억하고, 반대되는 정보는 작게 처리하는 경향이다. 바카라 플레이어는 맞힌 예측은 “내 reading이 통했다”고 기억하지만, 틀린 예측은 “그때만 예외였다”, “한 번 더 보면 맞았을 것”이라고 정리할 수 있다.

이렇게 되면 기록이 있어도 객관적 검토가 어렵다. 실제로는 맞고 틀린 결과가 섞여 있었지만, 기억 속에서는 성공 장면만 선명해져 자신의 바카라 감각을 과대평가하게 된다.

Gambler’s Fallacy와 Hot-Hand Thinking

과신은 서로 반대되는 믿음과도 결합한다. 하나는 “banker가 너무 많이 나왔으니 이제 player가 나올 때다”라는 gambler’s fallacy이고, 다른 하나는 “banker가 계속 나오고 있으니 더 이어질 것이다”라는 hot-hand thinking이다. 방향은 다르지만 둘 다 최근 결과에 과도한 의미를 부여한다는 점에서 비슷하다.

이 차이를 더 자세히 보고 싶다면 바카라에서 streak를 오해하는 방식을 함께 읽어볼 수 있다. 핵심은 특정 패턴이 눈에 보인다는 사실과 그 패턴이 다음 결과를 보장한다는 주장은 전혀 다르다는 점이다.

Loss Aversion과 손실 추격

과신한 베팅이 실패하면 심리적 압박은 더 커진다. 플레이어는 단순히 돈을 잃었다고 느끼는 것이 아니라 “내 판단이 틀렸다”는 불편함까지 경험한다. 이때 손실을 회복하고 자기 판단을 증명하려는 충동이 생기면 loss chasing으로 이어질 수 있다.

loss aversion in high-variance decisions는 이 과정을 이해하는 데 도움이 된다. 손실 회피 성향은 누구에게나 있을 수 있지만, 과신과 결합하면 쉬어야 할 순간에 오히려 더 크게 베팅하게 만들 수 있다.

바카라 과신 편향의 흔한 위험 신호

  • 최근 몇 번의 적중을 운보다 실력으로 해석한다.
  • 세션 시작 전에 정한 단위보다 빠르게 베팅 금액을 올린다.
  • 스코어보드를 보며 “이번은 확실하다”는 표현을 자주 쓴다.
  • 졌을 때도 분석이 틀렸다고 인정하지 않고, 다음 베팅으로 증명하려 한다.
  • banker, player, tie의 실제 house edge보다 자신의 감각을 더 신뢰한다.
  • 쉬어야 할 때 “한 번만 더 보면 흐름이 보인다”고 느낀다.
  • 이전 세션의 성공을 근거로 오늘도 같은 방식이 반복될 것이라고 기대한다.

이 신호들은 누군가를 비난하기 위한 목록이 아니다. 오히려 플레이 중 누구에게나 나타날 수 있는 마음의 자동 반응을 알아차리기 위한 체크리스트다.

과신은 bet sizing을 어떻게 바꾸는가?

예측보다 위험한 순간은 금액을 키울 때다

과신의 가장 큰 위험은 “생각이 틀릴 수 있다”는 사실 자체보다, 그 생각을 근거로 bet sizing을 바꾸는 순간에 있다. 같은 판단이라도 작은 단위에서는 제한된 위험으로 끝날 수 있지만, 확신이 stake escalation으로 이어지면 한 번의 변동성이 세션 전체를 흔들 수 있다.

Flat betting에서 갑자기 progression betting으로 넘어가거나, 손실 직후 단위를 올리는 행동은 과신과 손실 회피가 함께 작동한다는 신호일 수 있다. 베팅 금액이 커진다고 예측의 정확성이 높아지는 것은 아니다.

큰 베팅의 성공은 과신을 더 강하게 만든다

큰 베팅이 우연히 성공하면 “역시 내 판단이 맞았다”는 기억이 매우 강하게 남는다. 반대로 실패하면 손실 회복 압박이 커진다. 어느 쪽이든 감정의 진폭이 커지고, 다음 결정을 더 어렵게 만든다.

그래서 bankroll management는 승률을 올리는 시스템이 아니라 노출 규모를 통제하는 행동 장치로 봐야 한다. 예산, 단위, 시간 제한, 중단 기준을 사전에 정하는 방식은 baccarat bankroll management의 핵심이며, 과신이 커졌을 때도 자동으로 제동을 걸어준다.

바카라 과신 루프와 베팅 금액 증가 흐름도

자신감과 과신은 무엇이 다른가?

자신감은 계획 안에서 움직이는 감각에 가깝다. 예산을 알고, 단위를 지키고, 틀렸을 때 멈출 수 있으며, 결과가 운의 영향을 받는다는 점을 인정한다. 반면 과신은 결과를 자신의 reading 능력으로 과도하게 설명하고, 계획보다 감정에 따라 금액을 키우게 만든다.

통제 가능한 것은 예산, 베팅 단위, 시간 제한, 휴식, 게임 선택, tie나 side bet을 피하는 선택, 플레이 중단이다. 통제하기 어렵거나 제한적인 것은 다음 hand 결과, streak 지속 여부, shoe가 뜨겁다는 감각, 과거 결과가 다음 결과를 보장한다는 믿음이다.

표준적인 바카라에서 카드 카운팅이나 shoe composition에 관한 논의가 존재하더라도, 일반 플레이어가 실용적 우위를 안정적으로 얻는다고 말하기는 어렵다. 따라서 건전한 접근은 “흐름을 지배하는 법”이 아니라 “내가 통제할 수 있는 행동을 제한하는 법”에 더 가깝다.

베팅을 키우기 전 30초 자가 점검

다섯 가지 질문

  • 내가 지금 확률을 보고 있는가, 아니면 최근 감정을 보고 있는가?
  • 이 베팅 크기는 세션 시작 전에 정한 계획 안에 있는가?
  • 최근 승리가 반복 가능하다는 객관적 증거가 있는가?
  • 틀렸을 때 멈출 기준이 이미 정해져 있는가?
  • 지금 쉬면 불안하거나 아깝다는 느낌이 강한가?

30초 멈춤 규칙

큰 베팅을 하기 전 30초만 멈춰도 행동의 자동성을 줄일 수 있다. 이 시간 동안 사전 한도, 남은 예산, 플레이 시간, 손실 제한을 확인한다. 이 규칙은 치료법이나 승률 개선법이 아니라, 과신이 행동으로 번지기 전에 끊어주는 안전장치다.

특히 “이번만 올리고 다시 줄이자”는 생각이 반복된다면 그 자체가 점검 신호다. 과신은 대개 극적인 확신보다 작은 예외 허용에서 시작된다.

확신이 경고 신호가 되는 순간

도박이 더 이상 선택이나 오락처럼 느껴지지 않거나, 손실을 회복하기 위해 계속해야 한다는 압박이 커진다면 이는 전략 문제가 아닐 수 있다. 특정 플레이어를 진단할 수는 없지만, 멈추기 어렵고 일상 예산이나 관계에 영향을 준다면 도움을 요청하는 선택이 필요하다.

미국 기준으로 National Council on Problem Gambling은 National Problem Gambling Helpline을 통해 1-800-MY-RESET 전화, 문자, 채팅 지원을 24/7/365 제공하며 지역 리소스 연결을 안내한다. 국가와 지역별 지원 체계는 다를 수 있으므로, 자신의 위치에 맞는 공식 지원기관을 확인하는 것이 좋다.

Key Takeaways on Baccarat Overconfidence Bias

  • Baccarat Overconfidence Bias는 단기 성공을 실력으로 오해하게 만든다.
  • 낮은 house edge는 예측 가능성이나 통제 가능성을 뜻하지 않는다.
  • 가장 큰 위험은 확신이 bet sizing을 키우는 순간에 나타난다.
  • 스코어보드와 streak는 과거 설명처럼 보이지만 미래 결과를 보장하지 않는다.
  • 사전 한도, 작은 단위, 휴식, 30초 점검은 과신을 줄이는 실용적 장치다.

바카라에서 확신을 느끼는 것은 이상한 일이 아니다. 다만 그 확신이 계획을 바꾸고, 손실 후 더 큰 베팅을 정당화하고, 과거 성공을 미래의 증거처럼 만들 때는 멈춰 볼 필요가 있다. 책임 있는 플레이는 더 강한 확신을 만드는 일이 아니라, 확신이 과해질 때도 스스로를 보호할 구조를 미리 세우는 일이다.

Scroll to Top